Figure1 (Figure1)
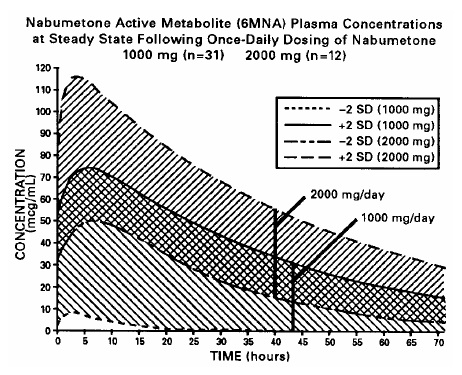
This is a graph showing the plasma concentrations of Nabumetone Active Metabolite (BMNA) at steady-state, after once-daily administration of either 1000mg or 2000mg of Nabumetone. The data includes 31 individuals taking 1000mg and 12 individuals taking 2000mg. The x-axis shows the time in hours after the dose, while the y-axis shows the plasma concentration. There is also a key that specifies which line corresponds to which dosage level.*