Valsartan And Hydrochlorothiazide Tablet, Film Coated
Product Images NDC 50090-5570

View Photos of Packaging, Regulatory Labels, and Product Appearance

Product Visual Gallery

This gallery contains 7 technical images submitted to the FDA as part of the official labeling for Valsartan And Hydrochlorothiazide (NDC 50090-5570). Unlike standard consumer photos, these assets often include clinical data figures, molecular chemical structures, and official manufacturer packaging layouts.

As provided by A-s Medication Solutions, these visuals offer a comprehensive scientific overview of the product's physical and chemical identity, aiding pharmacists and researchers in product verification and study.

FDA Label Image

Label Image (Lbl500905570)
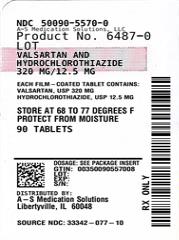
Label Image (Lbl500905570)
The image shows a medication label for Valsartan and Hydrochlorothiazide 320 mg/12.5 mg film-coated tablets. The label indicates the product is from A-S Medication Solutions, LLC, with NDC 50090-5570-0. The label provides storage instructions to keep the tablets at 68 to 77 degrees Fahrenheit and to protect from moisture. The package contains 90 tablets.*
FDA Label Image

Figure-1 (Valsartan Hctz Figure 1)

Figure-1 (Valsartan Hctz Figure 1)
A line graph showing the percentage of subjects with systolic blood pressure (SBP) below 140 mmHg plotted against baseline SBP values ranging from 140 to 180 mmHg. Four lines represent treatment groups: Valsartan HCT 320/25 mg (solid circles), Valsartan 320 mg (open triangles), Hydrochlorothiazide 25 mg (open squares), and placebo (crosses), illustrating effectiveness in lowering SBP relative to baseline.*
FDA Label Image

Figure-2 (Valsartan Hctz Figure 2)

Figure-2 (Valsartan Hctz Figure 2)
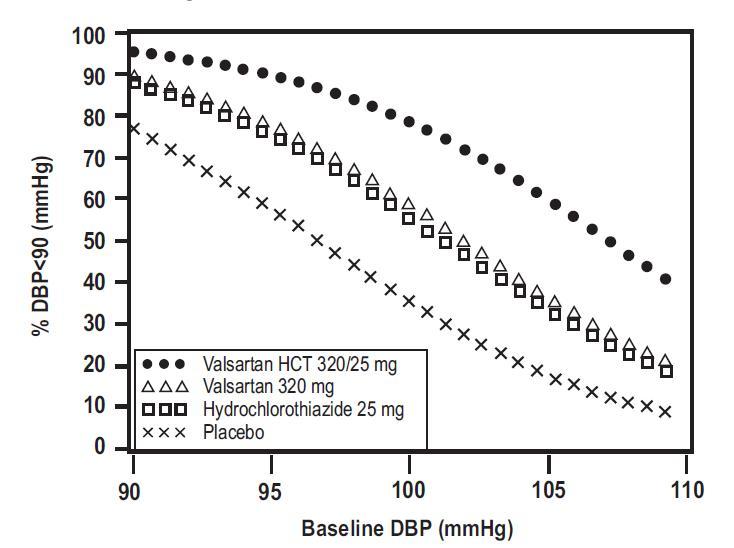
A line graph showing the percentage of patients with diastolic blood pressure less than 90 mmHg (% DBP<90) versus baseline diastolic blood pressure (DBP) in mmHg. Four treatment groups are compared: Valsartan HCT 320/25 mg, Valsartan 320 mg, Hydrochlorothiazide 25 mg, and Placebo, each represented by different symbols and lines on the graph.*
FDA Label Image

Figure-3 (Valsartan Hctz Figure 3)

Figure-3 (Valsartan Hctz Figure 3)
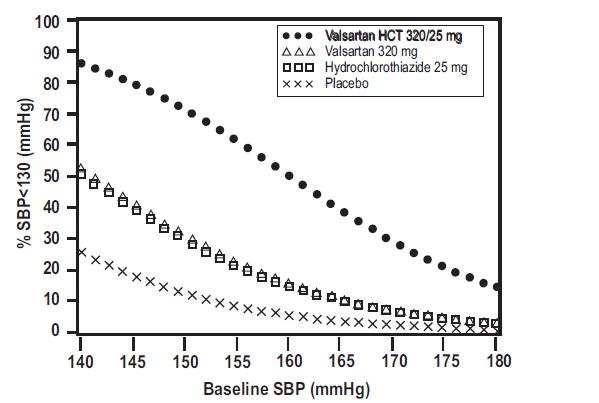
A line graph depicting the percentage of patients achieving systolic blood pressure (SBP) below 130 mmHg against baseline SBP levels in mmHg. The graph compares four groups: Valsartan HCT 320/25 mg, Valsartan 320 mg, Hydrochlorothiazide 25 mg, and placebo, showing the effect of each treatment on reducing SBP.*
FDA Label Image

Figure-4 (Valsartan Hctz Figure 4)

Figure-4 (Valsartan Hctz Figure 4)
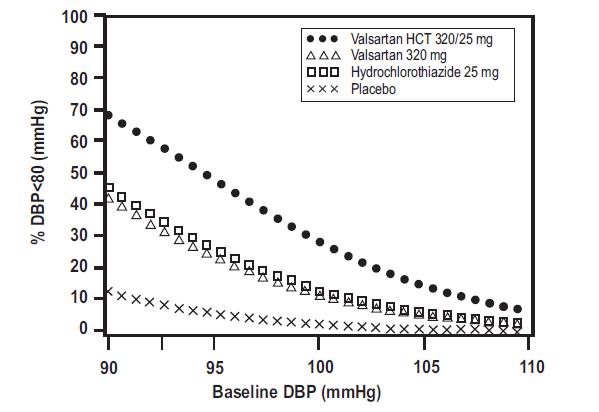
A line chart comparing the percentage of subjects with diastolic blood pressure below 80 mmHg versus baseline diastolic blood pressure in mmHg for four groups: Valsartan HCT 320/25 mg, Valsartan 320 mg, Hydrochlorothiazide 25 mg, and placebo. The chart uses different symbols to distinguish each group and shows trends over a baseline DBP range from 90 to 110 mmHg.*
FDA Label Image

Hctz-stru (Valsartan Hctz Hydrochlorothiazide)

Hctz-stru (Valsartan Hctz Hydrochlorothiazide)
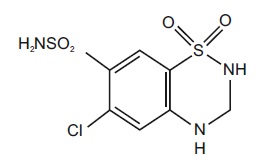
Chemical structure diagram depicting the molecular formula of the active ingredients Valsartan and Hydrochlorothiazide.*
FDA Label Image

Valsartan-str (Valsartan Hctz Valsartan)

Valsartan-str (Valsartan Hctz Valsartan)
Chemical structure diagram of the active ingredient Valsartan, showing its molecular framework including the benzimidazole and tetrazole rings.*

* About these descriptions: Image descriptions on this page are generated by automated AI analysis of the product label images from the manufacturer's FDA label submission (SPL). They are provided for reference only and may contain errors or omissions. Always rely on the printed label itself and the official FDA labeling, and consult a pharmacist or healthcare professional with any questions about this product.