Img-1 (Img 1)
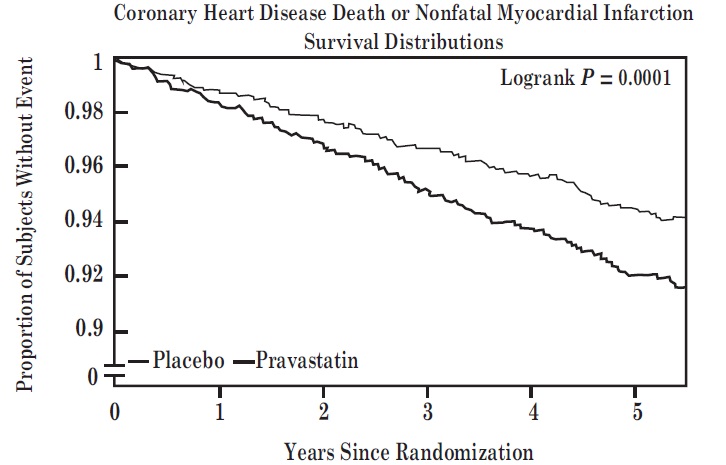
This text appears to be a chart or a graph showing the proportion of subjects without coronary heart disease death or nonfatal myocardial infarction over time. It includes survival distributions and a Logrank P value of 0.0001. The x-axis shows "Years since Randomization" and the y-axis shows the proportion of subjects without an event ranging from 0.92 to 0.98. The graph includes two lines representing the placebo and pravastatin groups.*