Wegovy Injection, Solution
Product Images NDC 50090-5824

23 FDA label images from A-s Medication Solutions · Packaging, Regulatory Labels, and Product Appearance

Product Visual Gallery

This gallery contains 23 technical images submitted to the FDA as part of the official labeling for Wegovy (NDC 50090-5824). Unlike standard consumer photos, these assets often include clinical data figures, molecular chemical structures, and official manufacturer packaging layouts.

As provided by A-s Medication Solutions, these visuals offer a comprehensive scientific overview of the product's physical and chemical identity, aiding pharmacists and researchers in product verification and study.

FDA Label Image

Structural-formula (Image 02)

Structural-formula (Image 02)
Chemical structure diagram of semaglutide, the active ingredient in WEGOVY .25 mg/0.5 mL subcutaneous injection by A-S Medication Solutions. The structure shows a peptide chain with labeled amino acid residues and attached chemical groups.*
FDA Label Image

Fig-2 (Image 03)

Fig-2 (Image 03)
A forest plot showing the relative exposure (Cavg) ratio and 90% confidence intervals for semaglutide injection in WEGOVY across various intrinsic factors including sex, age groups, race, ethnicity, body weight, renal function, and injection site (thigh versus upper arm). The graph compares the pharmacokinetic variability with a reference line at 1.0.*
FDA Label Image

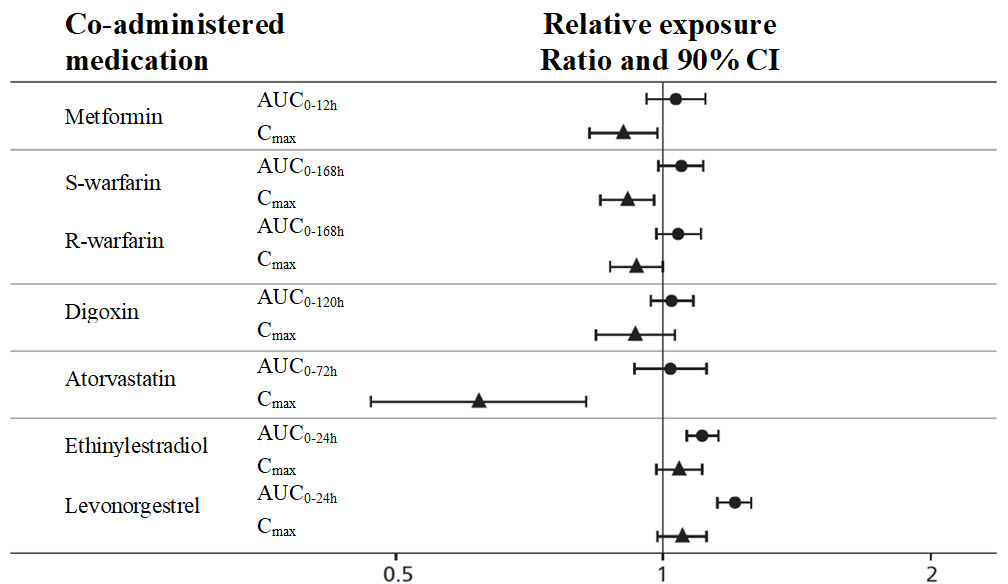
Figure-3 (Figure 3)

Figure-3 (Figure 3)
A forest plot illustrating relative exposure ratios and 90% confidence intervals for various co-administered medications with WEGOVY (semaglutide). The horizontal axis shows the ratio scale from 0.5 to 2.0. Medications listed include Metformin, S-warfarin, R-warfarin, Digoxin, Atorvastatin, Ethinylestradiol, and Levonorgestrel, with pharmacokinetic parameters AUC and Cmax analyzed. Data points with error bars represent the relative exposure and variability.*
FDA Label Image

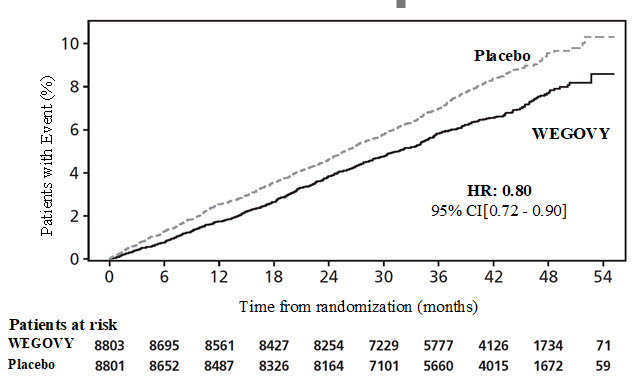
Figure-4 (Figure 4)

Figure-4 (Figure 4)
A Kaplan-Meier curve showing the percentage of patients with an event over time in months from randomization, comparing WEGOVY injection solution (.25 mg/.5 mL) to placebo. The graph plots event incidence up to 54 months, with WEGOVY showing a lower event rate than placebo. Patient numbers at risk for each group are provided below the time axis.*
FDA Label Image

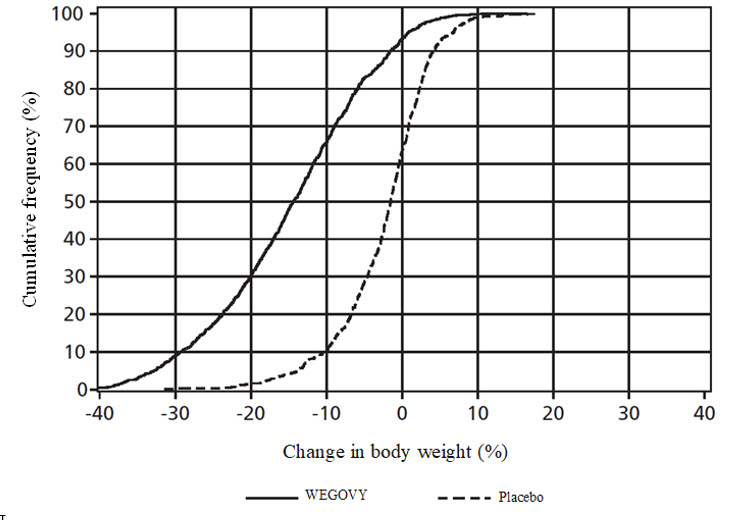
Figure-5 (Figure 5)

Figure-5 (Figure 5)
A cumulative frequency chart comparing percentage change in body weight between WEGOVY (semaglutide) and placebo groups. The x-axis represents change in body weight (%) from -40 to 40, and the y-axis shows cumulative frequency percentage from 0 to 100%. Solid line represents WEGOVY, dashed line represents placebo.*
FDA Label Image

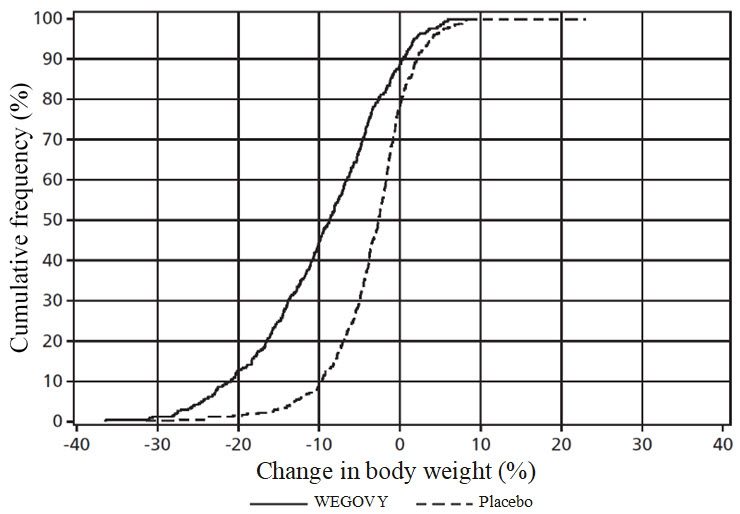
Figure-6 (Figure 6)

Figure-6 (Figure 6)
A cumulative frequency curve chart showing change in body weight (%) on the x-axis and cumulative frequency (%) on the y-axis. The graph compares WEGOVY (semaglutide) to placebo, with WEGOVY represented by a solid line and placebo by a dashed line, illustrating differences in body weight change distribution.*
FDA Label Image

Figure-7 (Figure 7)

Figure-7 (Figure 7)
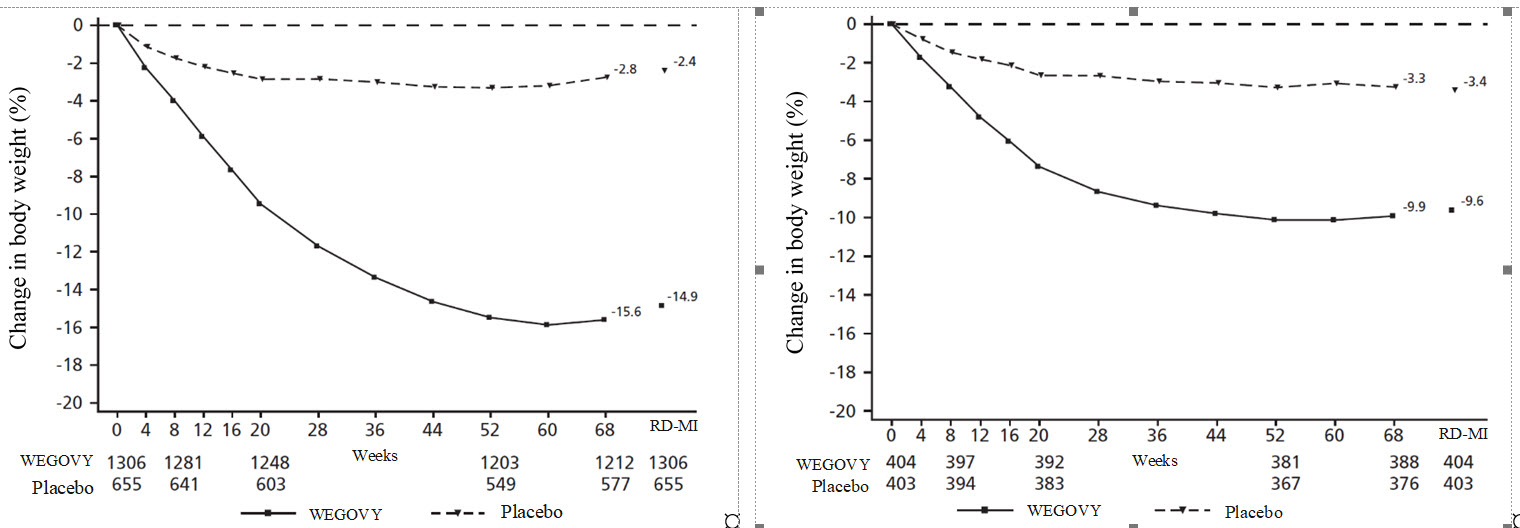
Two line graphs side by side illustrating the change in body weight percentage over time in weeks for WEGOVY (semaglutide) versus placebo groups. The left graph includes larger subject counts and shows a greater reduction in body weight for WEGOVY, with values near -15%. The right graph shows a similar trend with smaller subject counts and WEGOVY showing roughly -10% body weight change compared to placebo, which remains near -3%. Both graphs include legends and sample sizes below the x-axis.*
FDA Label Image

Figure-8 (Figure 8)

Figure-8 (Figure 8)
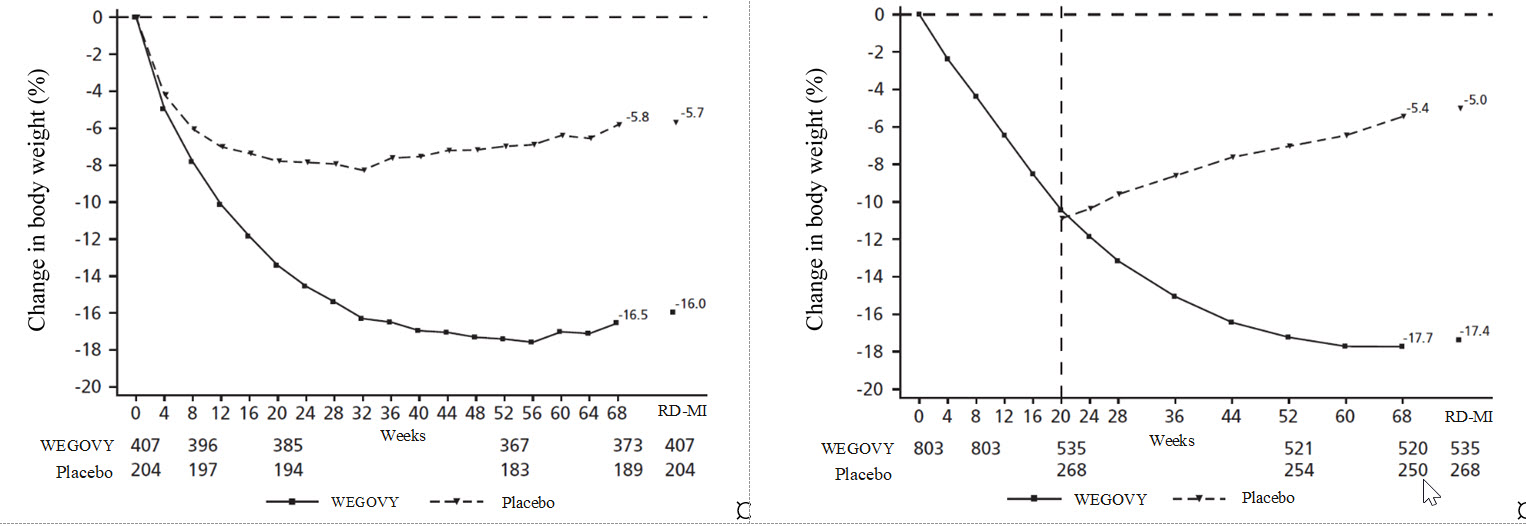
A pair of line charts depicting the percentage change in body weight over weeks for WEGOVY (semaglutide) versus placebo groups. Both charts show time on the x-axis and change in body weight (%) on the y-axis. WEGOVY groups exhibit a greater decrease in body weight compared to placebo across the study duration, with sample sizes noted for each time point below the x-axis.*
FDA Label Image

Figure-9 (Figure 9)

Figure-9 (Figure 9)
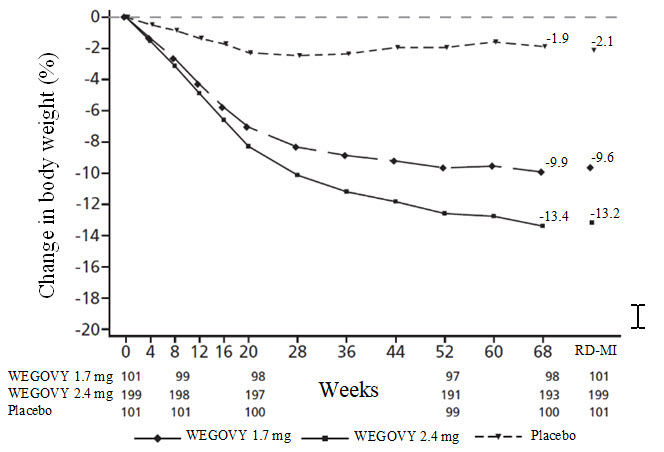
Line graph showing percentage change in body weight over 68 weeks comparing WEGOVY 1.7 mg, WEGOVY 2.4 mg, and placebo groups. Both WEGOVY doses show a greater decrease in body weight over time, while the placebo group remains relatively stable.*
FDA Label Image

Figure-10 (Figure 10)

Figure-10 (Figure 10)
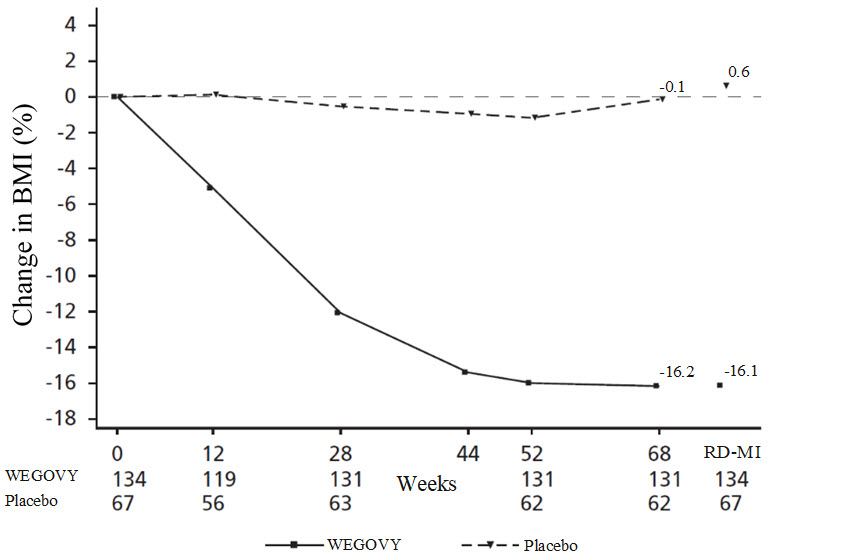
A line graph depicting the change in BMI (%) over weeks for WEGOVY (semaglutide) versus placebo. The x-axis shows weeks from 0 to 68 and RD-MI, while the y-axis shows percent change in BMI. WEGOVY shows a significant BMI reduction over time, reaching approximately -16.2%, compared to minimal change in the placebo group. Sample sizes for each time point and treatment group are also displayed below the x-axis.*
FDA Label Image

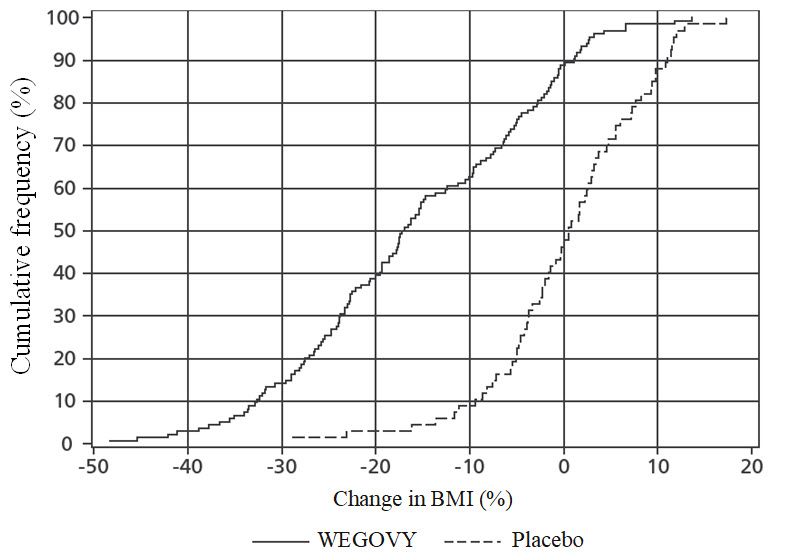
Figure-11 (Figure 11)

Figure-11 (Figure 11)
A cumulative frequency graph showing percent change in BMI for WEGOVY (semaglutide) compared to placebo. The x-axis represents percentage change in BMI ranging from -50% to 20%, and the y-axis shows cumulative frequency percentage from 0 to 100%. The solid line represents WEGOVY, and the dashed line represents placebo.*
FDA Label Image

Strength (Image 09)

Strength (Image 09)
WEGOVY injection, solution subcutaneous dosage form in various strengths displayed in color-coded boxes: 0.25 mg/0.5 mL in blue, 0.5 mg/0.5 mL in red, 1 mg/0.5 mL in orange, 1.7 mg/0.75 mL in blue, and 2.4 mg/0.75 mL in purple, indicating dosage strength per volume. Labeler A-S Medication Solutions.*
FDA Label Image

Pen-picture (Image 10)

Pen-picture (Image 10)
An instructional illustration showing the WEGOVY injection pen with a label indicating semaglutide 0.25 mg/0.5 mL. It includes a prompt to "Pull out to get started" and a visual guide demonstrating how to prepare the injection by extending the pen.*
FDA Label Image

Pen-parts (Image 11)

Pen-parts (Image 11)
An instructional diagram showing parts and usage of the WEGOVY pen containing semaglutide injection, 0.25 mg/0.5 mL. The image shows the pen before and after use, highlighting the expiration date location, pen window to check medicine clarity, needle cover to conceal the needle, pen cap removal instruction, and a yellow bar indicating dose completion after injection.*
FDA Label Image

Sharps-container (Image 14)

Sharps-container (Image 14)
An instructional illustration showing a hand holding a semaglutide injection pen connected to a needle, inserting it into a biohazard sharps disposal container. The image demonstrates proper disposal of the injection pen and needle after use.*
FDA Label Image

Ifu-3 (Image 12)

Ifu-3 (Image 12)
An instructional diagram showing recommended subcutaneous injection sites for WEGOVY (semaglutide). Areas indicated for injection include the upper arms, stomach, and upper legs, depicted on a simplified human figure.*
FDA Label Image

Step-3-4-illustrations (Image 13)

Step-3-4-illustrations (Image 13)
An instructional diagram showing the steps for using the WEGOVY injection pen. It includes three stages: 'Click 1' indicating the injection start, 'Click 2' instructing to hold for a few seconds until the yellow bar stops moving, and a final image showing the yellow bar fully stopped indicating injection completion, with advice to lift the pen slowly. A note states the injection takes about 5-10 seconds.*
FDA Label Image

Troubleshooting (Image 22)

Troubleshooting (Image 22)
An instructional illustration showing the removal of the pen cap from a WEGOVY (semaglutide) injection pen. The image highlights the pen cap being pulled downward to reveal the needle inside the subcutaneous injection pen device.*
FDA Label Image

Troubleshooting-2 (Image 23)

Troubleshooting-2 (Image 23)
An instructional illustration showing a hand holding a Wegovy 0.25 mg/0.5 mL subcutaneous injection pen, labeled with the product name and dosage strength. The image depicts the injection pen being positioned for administration with a downward arrow indicating direction, likely demonstrating proper use or injection technique.*
FDA Label Image

Caution (Image 15)

FDA Label Image

Contact (Image 16)

Contact (Image 16)
WEGOVY 0.25 mg/0.5 mL injection solution in a single-dose, prefilled pen for subcutaneous use. The label includes dosing information and usage instructions, and displays the labeler A-S Medication Solutions. The packaging is primarily white with green and black text.*
FDA Label Image

Logo (Image 01)

Logo (Image 01)
A data table displaying weight in pounds and kilograms across the top and height in inches and centimeters along the side. Cells contain numerical values with some highlighted in green, possibly representing specific measurements or thresholds related to weight and height correlations.*
FDA Label Image

Label Image (Lbl500905824)

Label Image (Lbl500905824)
WEGOVY 0.25 mg/0.5 mL injection label for semaglutide solution, subcutaneous route. The label indicates a single-dose prefilled pen with a lot number and storage instructions to store in refrigerator at 36°F to 46°F, protecting from light. Labeler is A-S Medication Solutions, Libertyville, IL, with NDC 50090-5824.*

* About these descriptions: Image descriptions on this page are generated by automated AI analysis of the product label images from the manufacturer's FDA label submission (SPL). They are provided for reference only and may contain errors or omissions. Always rely on the printed label itself and the official FDA labeling, and consult a pharmacist or healthcare professional with any questions about this product.