Alogliptin And Metformin Hydrochloride Tablet, Film Coated
Product Images NDC 50090-5993

7 FDA label images from A-s Medication Solutions · Packaging, Regulatory Labels, and Product Appearance

Product Visual Gallery

This gallery contains 7 technical images submitted to the FDA as part of the official labeling for Alogliptin And Metformin Hydrochloride (NDC 50090-5993). Unlike standard consumer photos, these assets often include clinical data figures, molecular chemical structures, and official manufacturer packaging layouts.

As provided by A-s Medication Solutions, these visuals offer a comprehensive scientific overview of the product's physical and chemical identity, aiding pharmacists and researchers in product verification and study.

FDA Label Image

Chemical Structure (Alogliptin 01)
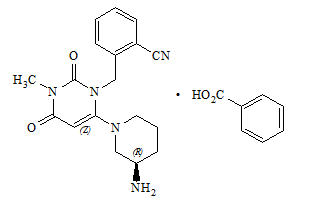
Chemical Structure (Alogliptin 01)
Chemical structure of alogliptin, part of the combination drug alogliptin and metformin hydrochloride. The diagram shows the molecular structure with aromatic rings, nitrogen, oxygen atoms, and functional groups characteristic of alogliptin.*
FDA Label Image

Chemical Structure (Alogliptin 02)

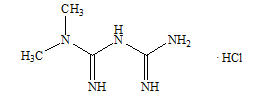
Chemical Structure (Alogliptin 02)
Chemical structure of alogliptin hydrochloride showing the molecular arrangement including methyl groups, amine, and amide functionalities with a hydrochloride component.*
FDA Label Image

Figure 1 (Alogliptin 03)

Figure 1 (Alogliptin 03)
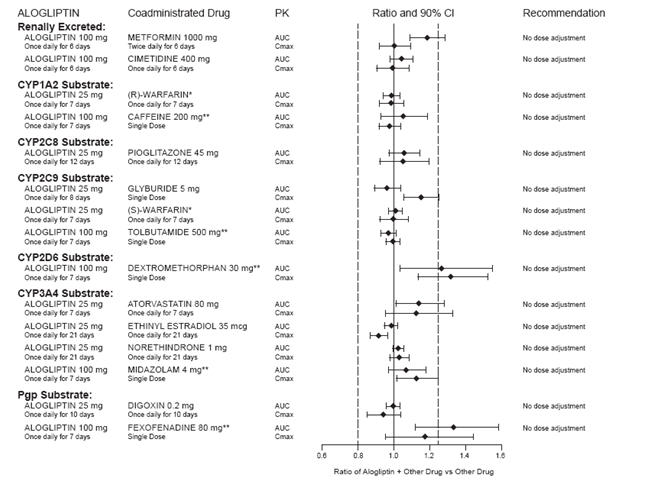
A forest plot chart depicting drug interaction pharmacokinetics for alogliptin coadministered with various drugs. The chart lists drugs across different metabolic pathways such as renal excretion, CYP1A2, CYP2C8, CYP2C9, CYP2D6, CYP3A4, and Pgp substrates, showing ratios and 90% confidence intervals for AUC and Cmax. Recommendations indicate no dose adjustments required.*
FDA Label Image

Figure 2 (Alogliptin 04)

Figure 2 (Alogliptin 04)
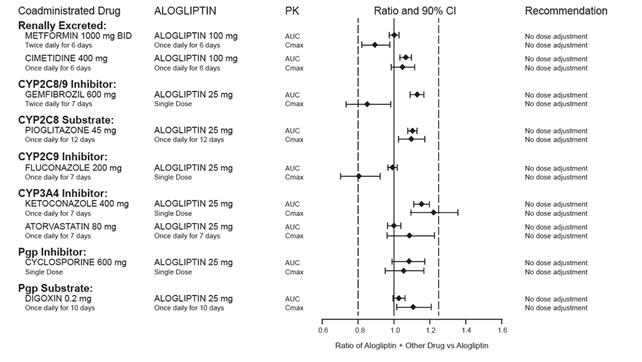
A forest plot chart displaying pharmacokinetic data of alogliptin in combination with various coadministered drugs. The chart includes ratios and 90% confidence intervals for parameters AUC and Cmax, with recommendations on dose adjustments, all indicating no dose adjustment needed.*
FDA Label Image

Figure 3 (Alogliptin 05)

Figure 3 (Alogliptin 05)
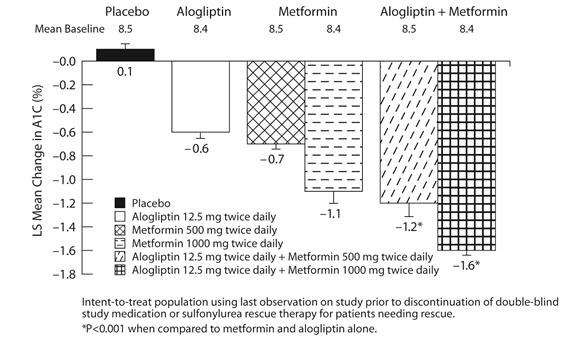
A bar chart comparing the least squares mean change in A1C percentage among placebo, alogliptin, metformin, and alogliptin plus metformin groups, each with specified dosages. The chart shows baseline values and mean changes, indicating the combined treatment groups had greater reductions in A1C compared to single treatments or placebo.*
FDA Label Image

Figure 4 (Alogliptin 06)

Figure 4 (Alogliptin 06)
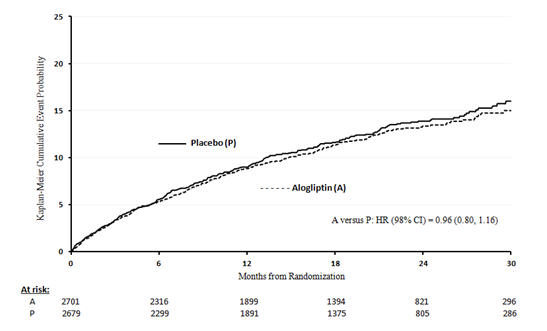
A Kaplan-Meier cumulative event probability graph comparing placebo and alogliptin over 30 months from randomization. The lines show cumulative event probabilities for each treatment group. Below the graph is a table showing patient numbers at risk at various time points for both groups, with a hazard ratio and confidence interval for alogliptin versus placebo indicated on the graph.*
FDA Label Image

Label Image (Lbl500905993)

Label Image (Lbl500905993)
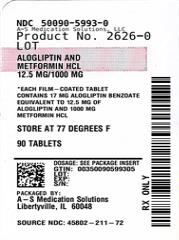
Packaging label for Alogliptin and Metformin Hydrochloride tablets, film coated, with a strength of 12.5 mg/1000 mg. The label shows the product is manufactured by A-S Medication Solutions and contains 90 tablets. Storage instructions specify keeping the product at 7 degrees Fahrenheit.*

* About these descriptions: Image descriptions on this page are generated by automated AI analysis of the product label images from the manufacturer's FDA label submission (SPL). They are provided for reference only and may contain errors or omissions. Always rely on the printed label itself and the official FDA labeling, and consult a pharmacist or healthcare professional with any questions about this product.