Segluromet
Product Images NDC 50090-6217

View Photos of Packaging, Regulatory Labels, and Product Appearance

Product Visual Gallery

This gallery contains 6 technical images submitted to the FDA as part of the official labeling for Segluromet (NDC 50090-6217). Unlike standard consumer photos, these assets often include clinical data figures, molecular chemical structures, and official manufacturer packaging layouts.

As provided by A-s Medication Solutions, these visuals offer a comprehensive scientific overview of the product's physical and chemical identity, aiding pharmacists and researchers in product verification and study.

FDA Label Image

Label Image (Lbl500906217)
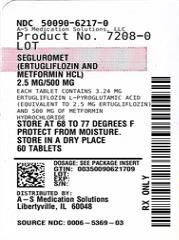
Label Image (Lbl500906217)
SEGLUROMET label from A-S Medication Solutions displays the product name and active ingredients ertugliflozin and metformin HCl, with strength 2.5 mg/500 mg per tablet. It includes storage instructions to keep below 77 degrees Fahrenheit, protect from moisture, and store in a dry place. The label also notes the package contains 60 tablets and provides lot and NDC numbers.*
FDA Label Image

Chemical Structure (Segluromet 01)

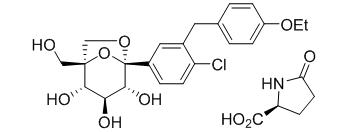
Chemical Structure (Segluromet 01)
Chemical structure diagram showing the molecular formula of the active ingredient for SEGLUROMET, as provided. The structure includes various functional groups and rings typical for this compound.*
FDA Label Image

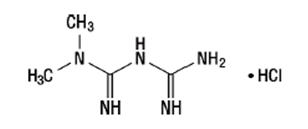
Chemical Structure (Segluromet 02)

Chemical Structure (Segluromet 02)
Chemical structure of the active ingredient in SEGLUROMET, showing a molecule with amine and guanidine groups, represented along with hydrochloride (HCl).*
FDA Label Image

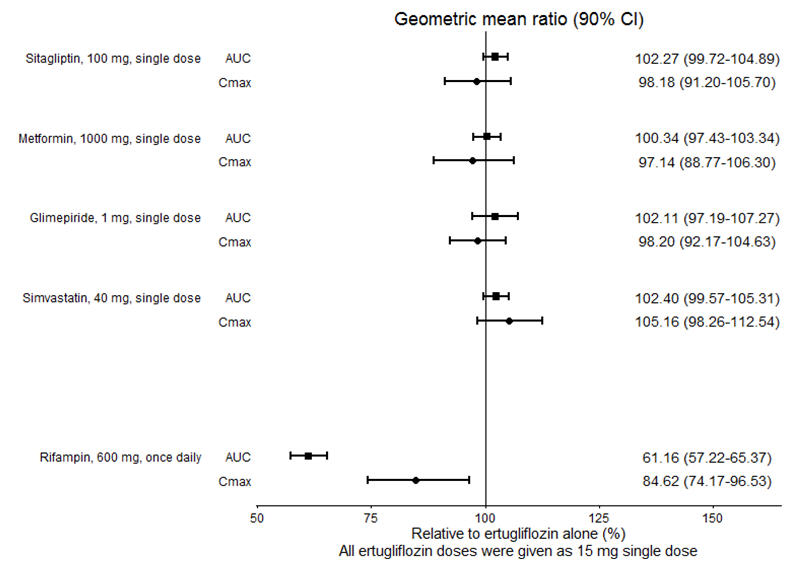
Figure 1 (Segluromet 03)

Figure 1 (Segluromet 03)
A forest plot showing the geometric mean ratio with 90% confidence intervals for AUC and Cmax of various drugs relative to ertugliflozin alone. Drugs listed include Sitagliptin 100 mg, Metformin 1000 mg, Glimepiride 1 mg, Simvastatin 40 mg, and Rifampin 600 mg. The x-axis represents relative percentage values from 50% to 150%, with data points plotted accordingly.*
FDA Label Image

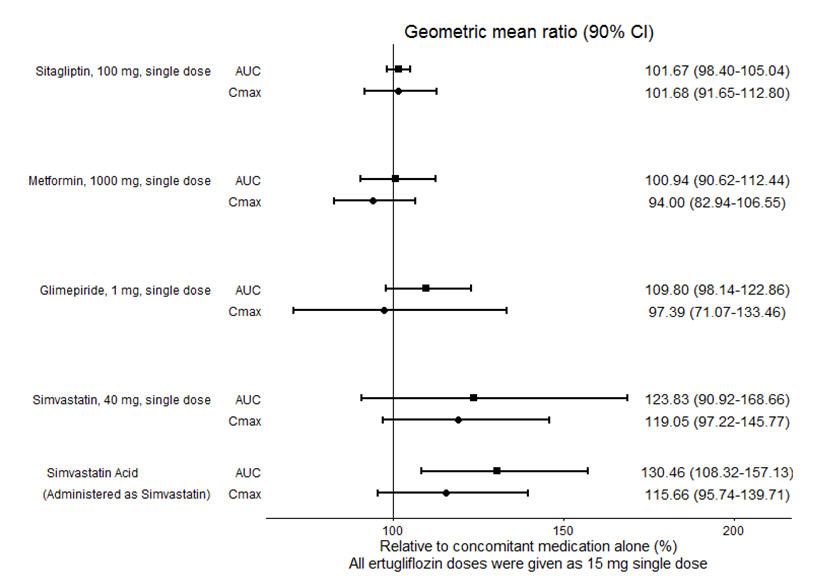
Figure 2 (Segluromet 04)

Figure 2 (Segluromet 04)
A forest plot showing geometric mean ratios with 90% confidence intervals for AUC and Cmax values of various drugs including Sitagliptin 100 mg, Metformin 1000 mg, Glimepiride 1 mg, Simvastatin 40 mg, and Simvastatin Acid compared to concomitant medication alone. The chart includes data points indicating relative percentages and error bars illustrating variability.*
FDA Label Image

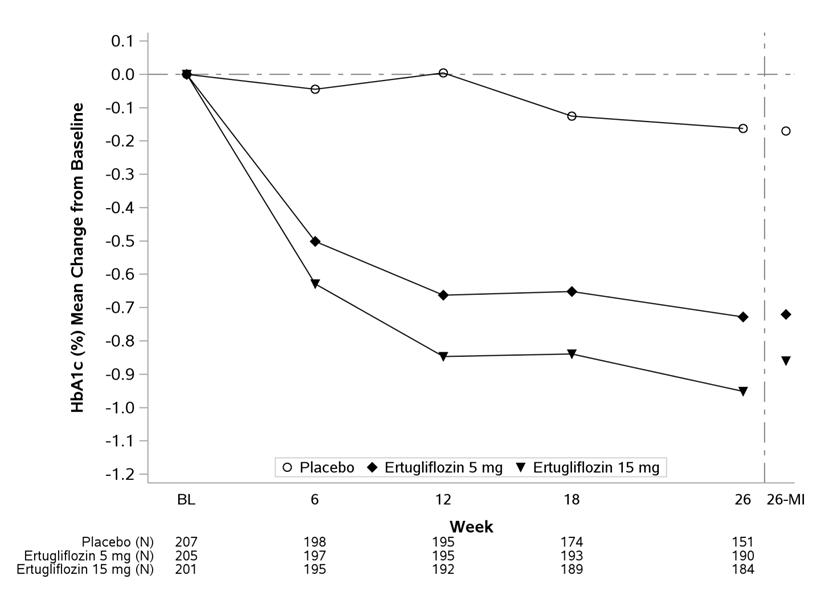
Figure 3 (Segluromet 05)

Figure 3 (Segluromet 05)
A line chart showing mean percentage change in HbA1c from baseline over 26 weeks for three groups: Placebo, Ertugliflozin 5 mg, and Ertugliflozin 15 mg. The x-axis represents study weeks with sample sizes noted, and the y-axis shows HbA1c mean change percentages. Data points indicate that Ertugliflozin groups show greater HbA1c reduction compared to placebo over time.*

* About these descriptions: Image descriptions on this page are generated by automated AI analysis of the product label images from the manufacturer's FDA label submission (SPL). They are provided for reference only and may contain errors or omissions. Always rely on the printed label itself and the official FDA labeling, and consult a pharmacist or healthcare professional with any questions about this product.