Valsartan And Hydrochlorothiazide Tablet, Film Coated
Product Images NDC 50090-6232

View Photos of Packaging, Regulatory Labels, and Product Appearance

Product Visual Gallery

This gallery contains 7 technical images submitted to the FDA as part of the official labeling for Valsartan And Hydrochlorothiazide (NDC 50090-6232). Unlike standard consumer photos, these assets often include clinical data figures, molecular chemical structures, and official manufacturer packaging layouts.

As provided by A-s Medication Solutions, these visuals offer a comprehensive scientific overview of the product's physical and chemical identity, aiding pharmacists and researchers in product verification and study.

FDA Label Image

C:\users\ra\desktop\1.jpg (5a5eca60 Figure 01)
C:\users\ra\desktop\1.jpg (5a5eca60 Figure 01)
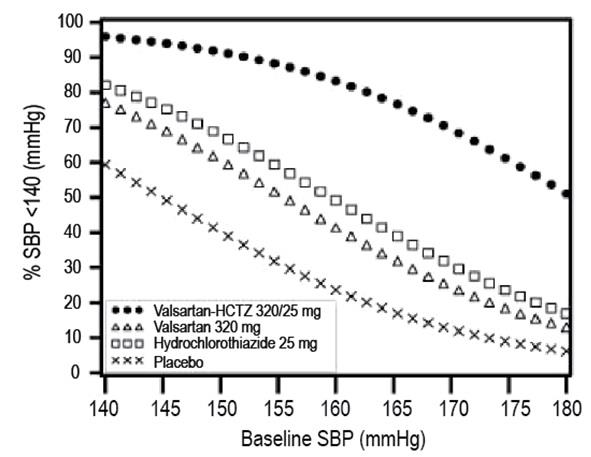
A line graph comparing the percentage of patients achieving systolic blood pressure (SBP) under 140 mmHg across different baseline SBP values (140 to 180 mmHg). The graph includes four groups: Valsartan-HCTZ 320/25 mg, Valsartan 320 mg, Hydrochlorothiazide 25 mg, and placebo, showing the efficacy of each treatment in reducing SBP.*
FDA Label Image

C:\users\ra\desktop\2.jpg (5a5eca60 Figure 02)

C:\users\ra\desktop\2.jpg (5a5eca60 Figure 02)
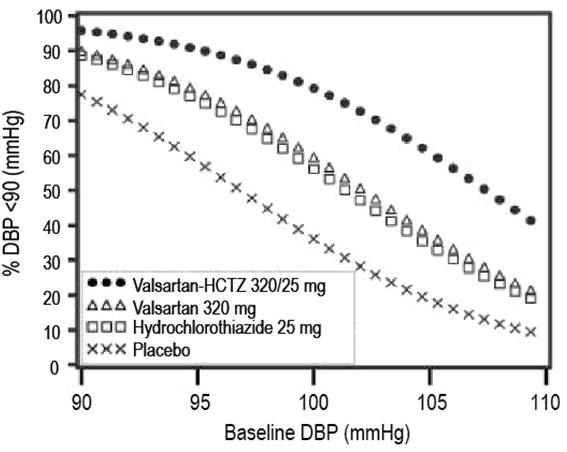
A line graph depicting the percentage of patients achieving diastolic blood pressure (DBP) below 90 mmHg across varying baseline DBP levels from 90 to 110 mmHg. The graph compares effects of Valsartan-HCTZ 320/25 mg, Valsartan 320 mg, Hydrochlorothiazide 25 mg, and placebo treatments, each represented by distinct symbols in the legend.*
FDA Label Image

C:\users\ra\desktop\3.jpg (5a5eca60 Figure 03)

C:\users\ra\desktop\3.jpg (5a5eca60 Figure 03)
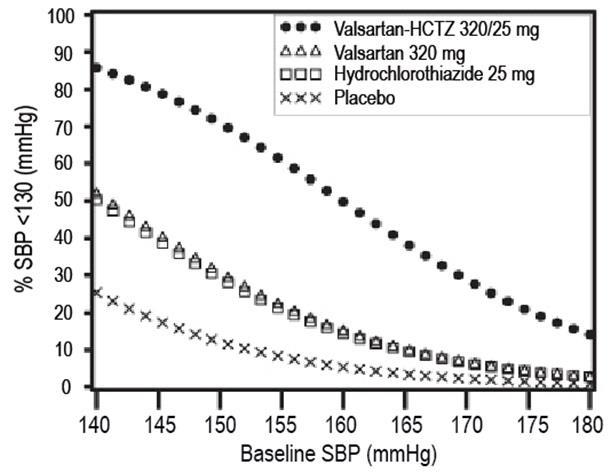
A line graph comparing the percentage of patients with systolic blood pressure (SBP) under 130 mmHg against baseline SBP (mmHg). The graph includes four data series: Valsartan-HCTZ 320/25 mg, Valsartan 320 mg, Hydrochlorothiazide 25 mg, and Placebo. The y-axis represents the percentage of patients, and the x-axis shows baseline SBP ranging from 140 to 180 mmHg.*
FDA Label Image

C:\users\ra\desktop\4.jpg (5a5eca60 Figure 04)

C:\users\ra\desktop\4.jpg (5a5eca60 Figure 04)
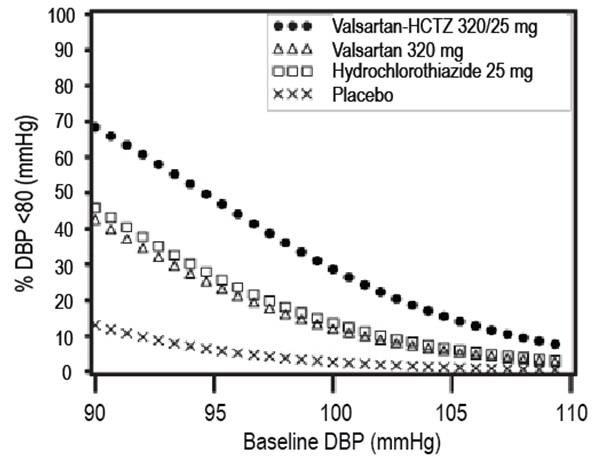
A line graph showing percentage of diastolic blood pressure (DBP) less than 80 mmHg versus baseline DBP values from 90 to 110 mmHg. The graph compares four groups: Valsartan-HCTZ 320/25 mg, Valsartan 320 mg, Hydrochlorothiazide 25 mg, and Placebo, with distinct markers for each group indicated in the legend. The percentage achieving DBP below 80 decreases as baseline DBP increases for all groups.*
FDA Label Image

C:\users\ra\desktop\5.jpg (5a5eca60 Figure 05)

C:\users\ra\desktop\5.jpg (5a5eca60 Figure 05)
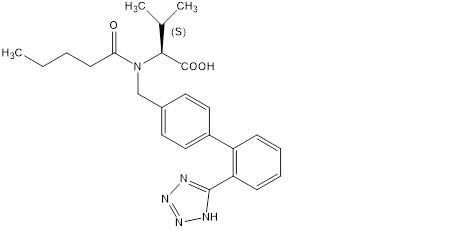
Chemical structure diagram of valsartan, one of the active ingredients in the medication Valsartan and Hydrochlorothiazide.*
FDA Label Image

C:\users\ra\desktop\6.jpg (5a5eca60 Figure 06)

C:\users\ra\desktop\6.jpg (5a5eca60 Figure 06)
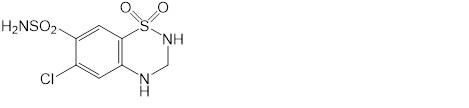
Chemical structure diagram of the active ingredient shown in the product, valsartan and hydrochlorothiazide combination. The structure depicts the molecular arrangement including sulfonamide and chlorinated aromatic rings consistent with hydrochlorothiazide.*
FDA Label Image

Label Image (Lbl500906232)

Label Image (Lbl500906232)
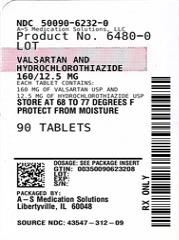
Label for VALSARTAN AND HYDROCHLOROTHIAZIDE 160 mg/12.5 mg film-coated tablets by A-S Medication Solutions. The package contains 90 oral tablets. Storage instructions specify to keep at 68 to 77 degrees Fahrenheit and protect from moisture. The label includes the product NDC 50090-6232-0 and a QR code for dosage information.*

* About these descriptions: Image descriptions on this page are generated by automated AI analysis of the product label images from the manufacturer's FDA label submission (SPL). They are provided for reference only and may contain errors or omissions. Always rely on the printed label itself and the official FDA labeling, and consult a pharmacist or healthcare professional with any questions about this product.