Donepezil Hydrochloride Tablet, Film Coated
Product Images NDC 50090-6329

View Photos of Packaging, Regulatory Labels, and Product Appearance

Product Visual Gallery

This gallery contains 15 technical images submitted to the FDA as part of the official labeling for Donepezil Hydrochloride (NDC 50090-6329). Unlike standard consumer photos, these assets often include clinical data figures, molecular chemical structures, and official manufacturer packaging layouts.

As provided by A-s Medication Solutions, these visuals offer a comprehensive scientific overview of the product's physical and chemical identity, aiding pharmacists and researchers in product verification and study.

FDA Label Image

Fig-1 (Donepezil Figure 1)

Fig-1 (Donepezil Figure 1)
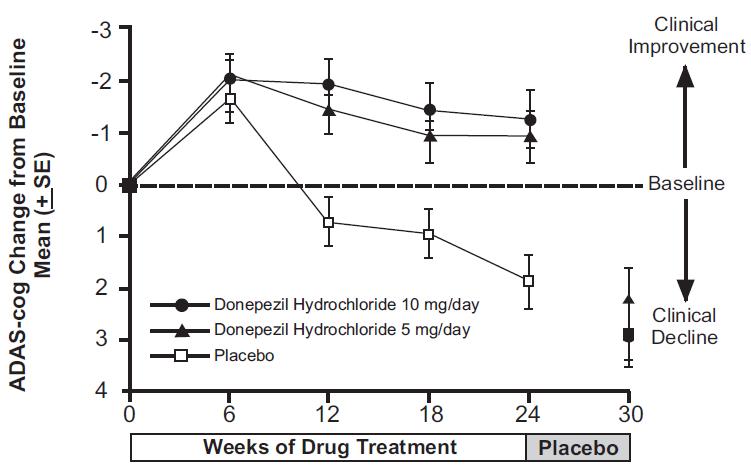
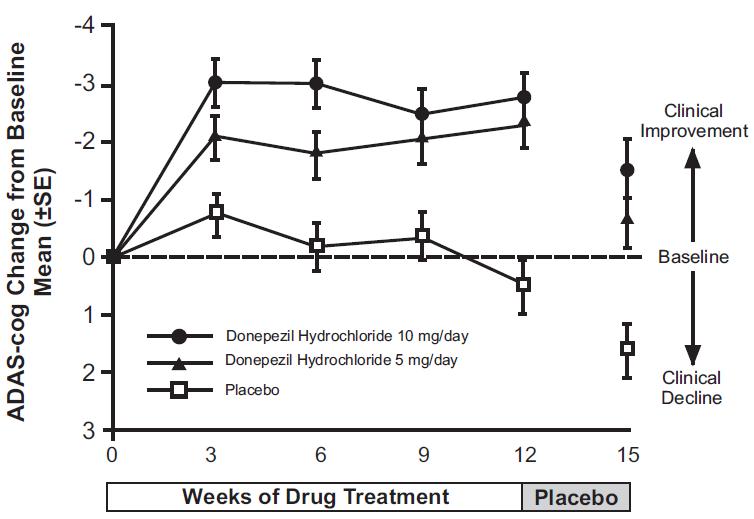
The text describes a graph showing the ADAS-cog Change from Baseline observed in clinical trials of different drug treatments for Alzheimer's disease. The graph shows the mean score (+ SE) at each time point (0, 6, 12, 18, 24, and 30 weeks) for four treatment groups: Donepezil Hydrochloride 10mg/day + Gingko Biloba, Donepezil Hydrochloride 5mg/day, Dacine, and Placebo. The ADAS-cog is a test used to assess cognitive function in patients with Alzheimer's disease. The graph shows a clinical improvement (score reduction) in the Donepezil Hydrochloride 10mg/day + Gingko Biloba and Donepezil Hydrochloride 5mg/day groups compared to the placebo group. The Dacine group showed no significant improvement.*
FDA Label Image

Fig-10 (Donepezil Figure 10)

Fig-10 (Donepezil Figure 10)
This appears to be a graph displaying the cumulative percentage of patients taking Donepezil Hydrochloride 10mg/day compared to a placebo over time. There is also a line graph depicting the change in ADCS-ADL (Alzheimer's Disease Cooperative Study Activities of Daily Living) from baseline with time.*
FDA Label Image

Fig-11 (Donepezil Figure 11)

FDA Label Image

Fig-12 (Donepezil Figure 12)

FDA Label Image

Fig-13 (Donepezil Figure 13)

Fig-13 (Donepezil Figure 13)
This appears to be a graph illustrating the percentage of patients who were given either 23mg/day or 10mg/day of Donepezil Hydrochloride and how they improved or worsened based on their CIBIC-plus rating. The graph shows various levels of improvement ranging from Markedly Improved to Markedly Worse.*
FDA Label Image

Fig-2 (Donepezil Figure 2)

Fig-2 (Donepezil Figure 2)
This appears to be a table showing the results of a clinical trial comparing the effects of Donepezil hydrochloride at 5mg and 10mg dosages versus a placebo group on patients with ADAS-cog. It shows the percentage of patients in each group who experienced a change in their scores on the ADAS-cog scale, with measurements taken at baseline and after treatment. The results demonstrate a significant improvement in ADAS-Cog scores for both dosages of Donepezil compared to the placebo group.*
FDA Label Image

Fig-3 (Donepezil Figure 3)

Fig-3 (Donepezil Figure 3)
This is a table that shows the percentage of patients who received different doses of Donepezil Hydrochloride medication and placebo. The table measures the effectiveness of the medication by rating the patients as markedly improved, moderately improved, minimally improved, no change, minimally worse, moderately worse, or markedly worse using CIBIC-plus rating.*
FDA Label Image

Fig-4 (Donepezil Figure 4)

FDA Label Image

Fig-5 (Donepezil Figure 5)

Fig-5 (Donepezil Figure 5)
This appears to be a chart or graph showing the cumulative percentage of patients and their change in ADAS-cog for different treatment groups. The treatment groups include Donepezil Hydrochloride 5 mg/day, Donepezil Hydrochloride 10 mg/day, and Placebo. The change in ADAS-cog is represented by points on a scale of -7 to 0. The chart shows the percentage of patients in each treatment group who experienced a change in ADAS-cog at each point on the scale. There are also lines connecting the points for each treatment group to show the overall trend.*
FDA Label Image

Fig-6 (Donepezil Figure 6)

FDA Label Image

Fig-7 (Donepezil Figure 7)

FDA Label Image

Fig-8 (Donepezil Figure 8)

Fig-8 (Donepezil Figure 8)
The text describes a graph showing the cumulative percentage of patients taking Donepezil Hydrochloride 10mg/day and placebo. The graph also shows the SIB (Severe Impairment Battery) change from baseline for patients.*
FDA Label Image

Fig-9 (Donepezil Figure 9)

Fig-9 (Donepezil Figure 9)
This is a graph showing the change in ADCS-ADL score from baseline for patients treated with Donepezil Hydrochloride 10 mg/day and placebo over a period of 36 months. There is no other available information in the given text.*
FDA Label Image

Str (Donepezil Str)

FDA Label Image

Label Image (Lbl500906329)

Label Image (Lbl500906329)
This is a description of medication, specifically Donepezil Hydrochloride tablets with a strength of 5mg per tablet. The product number is 6310-0 and there are 90 tablets in the package. The suggested storage temperature is at 68-77 degrees Fahrenheit.*

* These product label images have been analyzed using experimental machine learning. Please verify findings with the primary label text.