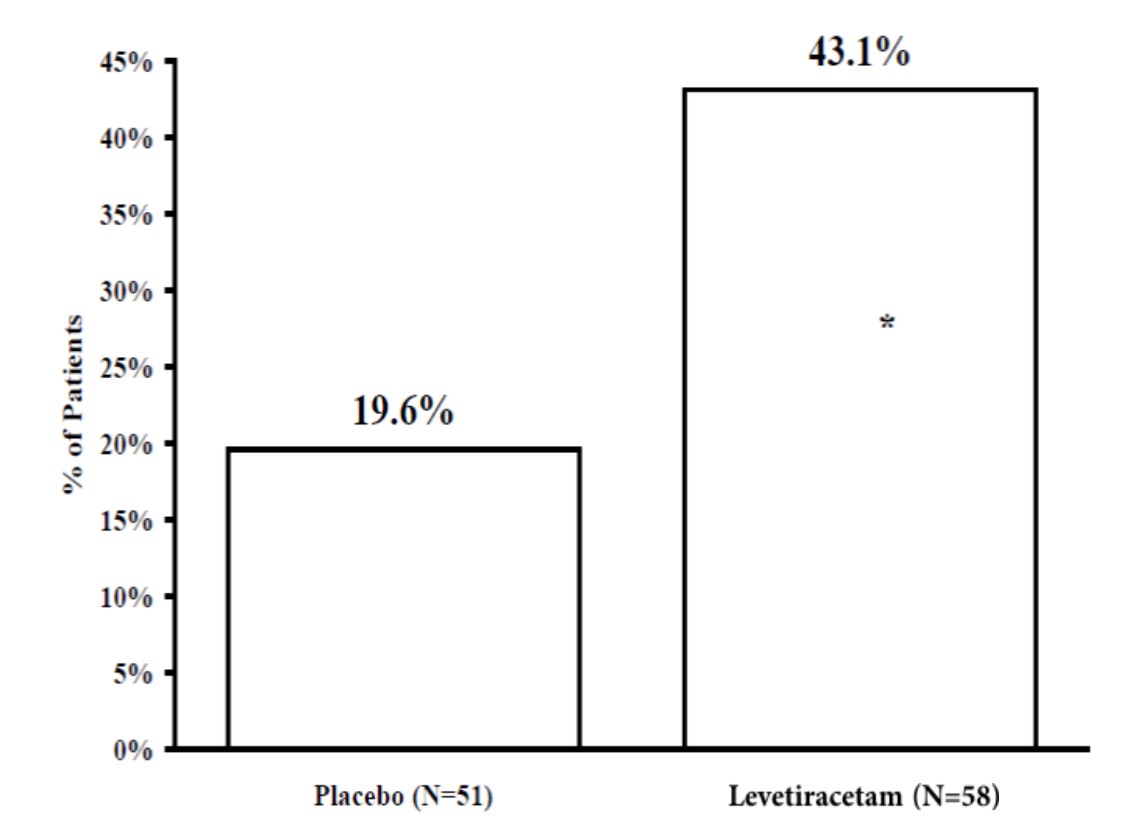
Figure 1 (E24dd8a7 86c4 4979 8f2e Da2d82f5d6d8 01)

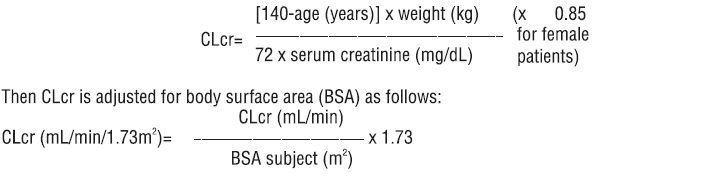
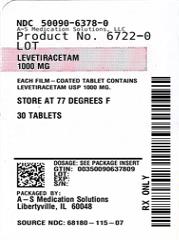
This text is providing instructions for calculating the total daily dose in mL for a patient based on their weight and the daily dose prescribed in mg/kg/day. The information also mentions a concentration of 100 mg/mL.*