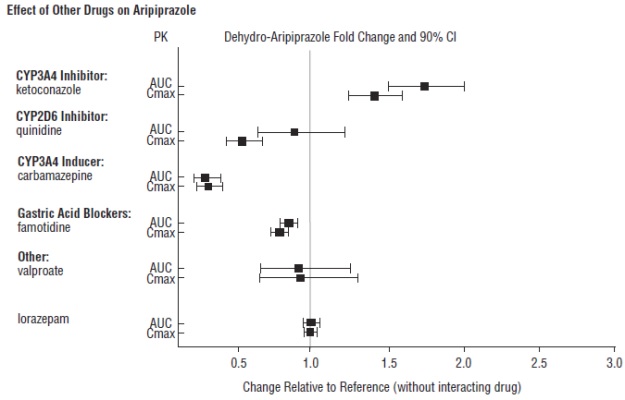
Figure (Aripiprazole Fig1)
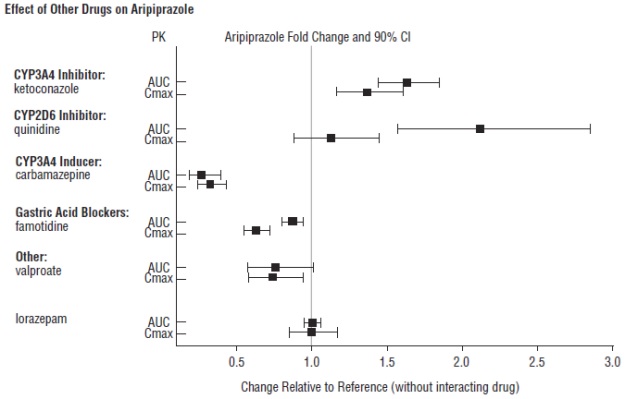
The text describes the effect of different drugs on Aripiprazole, indicating the fold change and 90% confidence interval. Several inhibitors and inducers of enzymes such as CYP3AA and CYP206 are mentioned, along with others like valproate and lorazepam. The text also mentions the change relative to the reference without the interacting drug.*