Lokelma Powder, For Suspension
Product Images NDC 50090-6502

View Photos of Packaging, Regulatory Labels, and Product Appearance

Product Visual Gallery

This gallery contains 6 technical images submitted to the FDA as part of the official labeling for Lokelma (NDC 50090-6502). Unlike standard consumer photos, these assets often include clinical data figures, molecular chemical structures, and official manufacturer packaging layouts.

As provided by A-s Medication Solutions, these visuals offer a comprehensive scientific overview of the product's physical and chemical identity, aiding pharmacists and researchers in product verification and study.

FDA Label Image

Figure 1 (Figure 1)

Figure 1 (Figure 1)
Chemical structure of sodium zirconium cyclosilicate, showing the arrangement of zirconium (Zr), silicon (Si), and oxygen (O) atoms in the molecule.*
FDA Label Image

Figure_2 (Figure 2)

Figure_2 (Figure 2)
A pharmacokinetic chart depicting the ratio of various drugs' AUC and Cmax values when co-administered with Lokelma (10 g and 15 g) compared to the drugs administered alone. The chart shows multiple medications with their dosages on the left and corresponding per-drug ratio plots with confidence intervals on the right, illustrating how Lokelma affects drug exposure and peak concentration.*
FDA Label Image

Figure_3 (Figure 3)

Figure_3 (Figure 3)
A line graph depicting mean serum potassium levels (mEq/L) with 95% confidence intervals over time during an acute phase (hours) and a randomized withdrawal phase (days). Different treatment groups are shown using various symbols and dashed lines, including 10 g three times daily, placebo, and dosages of 5 g, 10 g, and 15 g once daily, illustrating potassium level trends in each group across these time periods.*
FDA Label Image

Figure 4 (Figure 4)

Figure 4 (Figure 4)
A line graph depicting mean serum potassium levels (mEq/L) over time in weeks with 95% confidence intervals. The graph includes symbols representing acute phase baseline (APBL), titrated doses, and off-treatment periods. The x-axis spans from acute phase baseline through approximately 48 weeks, last visit, and end of study. The y-axis ranges from 4.0 to 6.0 mEq/L serum potassium levels.*
FDA Label Image

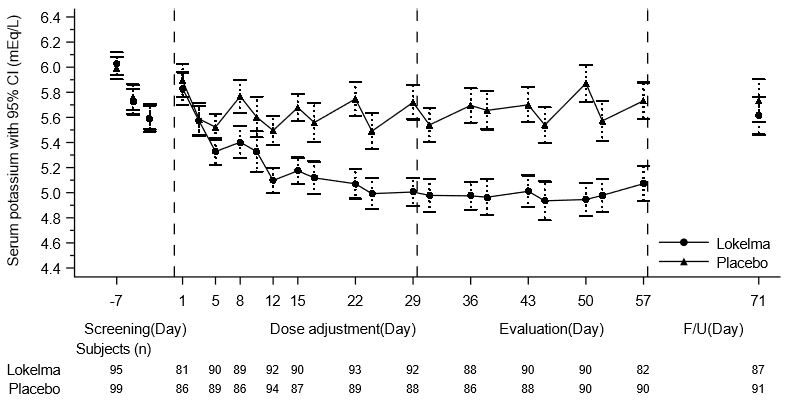
Figure_5 (Image 01)

Figure_5 (Image 01)
A line graph comparing serum potassium levels (mEq/L) over time between Lokelma and placebo groups. The x-axis shows study days divided into Screening, Dose adjustment, Evaluation, and Follow-Up phases, while the y-axis shows serum potassium with 95% confidence intervals. Lokelma shows a trend of decreasing potassium from day 1, whereas placebo shows a relatively stable trend.*
FDA Label Image

Label Image (Lbl500906502)

Label Image (Lbl500906502)
LOKELMA 5 g/5 g powder for suspension oral use product label from A-S Medication Solutions. The label indicates the product contains sodium zirconium cyclosilicate in individual 5 g packets, with a total of 30 packets per container. Storage instructions specify 15 to 85 degrees Fahrenheit. The label includes NDC 50090-6502-0 and a QR code.*

* About these descriptions: Image descriptions on this page are generated by automated AI analysis of the product label images from the manufacturer's FDA label submission (SPL). They are provided for reference only and may contain errors or omissions. Always rely on the printed label itself and the official FDA labeling, and consult a pharmacist or healthcare professional with any questions about this product.