Oxybutynin Chloride Tablet, Extended Release
Product Images NDC 50090-6673

View Photos of Packaging, Regulatory Labels, and Product Appearance

Product Visual Gallery

This gallery contains 8 technical images submitted to the FDA as part of the official labeling for Oxybutynin Chloride (NDC 50090-6673). Unlike standard consumer photos, these assets often include clinical data figures, molecular chemical structures, and official manufacturer packaging layouts.

As provided by A-s Medication Solutions, these visuals offer a comprehensive scientific overview of the product's physical and chemical identity, aiding pharmacists and researchers in product verification and study.

FDA Label Image

Figure 1 (Fig 1)

Figure 1 (Fig 1)
A line graph comparing mean plasma R-oxybutynin concentration (ng/mL) over 24 hours for Oxybutynin Chloride extended-release tablets 10 mg once daily (QD) versus oxybutynin 5 mg three times daily (TID). The graph shows concentration on the vertical axis and time in hours on the horizontal axis, with error bars indicating variability.*
FDA Label Image

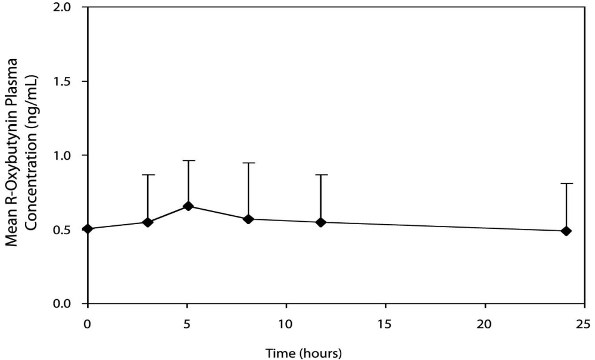
Figure 2 (Fig 2)

Figure 2 (Fig 2)
A line graph showing the mean R-Oxybutynin plasma concentration (ng/mL) over time (hours). The plot displays data points with error bars at several time intervals within 24 hours, showing concentration values near 0.5 to 0.7 ng/mL initially, remaining relatively stable and then slightly declining by 24 hours.*
FDA Label Image

Figure 3 (Figure 3)

Figure 3 (Figure 3)
This chart compares effects between oxybutynin chloride extended-release tablets and placebo, showing horizontal error bars for each. The x-axis is marked with values ranging from -40 to 40, suggesting a scale for measured outcomes. The chart highlights a statistically significant effect for oxybutynin chloride compared to placebo.*
FDA Label Image

Figure 4 (Figure 4)

Figure 4 (Figure 4)
A horizontal error bar chart comparing oxybutynin levels for oxybutynin chloride extended-release tablets and oxybutynin alone. The x-axis ranges from -40 to 40, with zero centered. Each data point shows a central value with symmetrical error bars.*
FDA Label Image

Figure 5 (Figure 5)

Figure 5 (Figure 5)
A horizontal forest plot comparing oxybutynin chloride extended-release tablets and oxybutynin, showing effect size estimates with confidence intervals on a scale ranging from -40 to 40. The plot visually represents the comparative data points and uncertainty for the two forms of oxybutynin.*
FDA Label Image

Label Image (Lbl500906673)

Label Image (Lbl500906673)
Oxybutynin Chloride Extended Release 10 mg oral tablets packaging label from A-S Medication Solutions. The label lists the NDC 50090-6673-0 and indicates 90 tablets in the container. It directs storage at 77 degrees Fahrenheit, protected from moisture and humidity.*
FDA Label Image
FDA Label Image

Structure (Structural Formula)

Structure (Structural Formula)
Chemical structure diagram of oxybutynin chloride, showing its molecular arrangement including aromatic rings, ester linkage, and hydrochloride salt form.*

* About these descriptions: Image descriptions on this page are generated by automated AI analysis of the product label images from the manufacturer's FDA label submission (SPL). They are provided for reference only and may contain errors or omissions. Always rely on the printed label itself and the official FDA labeling, and consult a pharmacist or healthcare professional with any questions about this product.