Figure1 (Figure1)
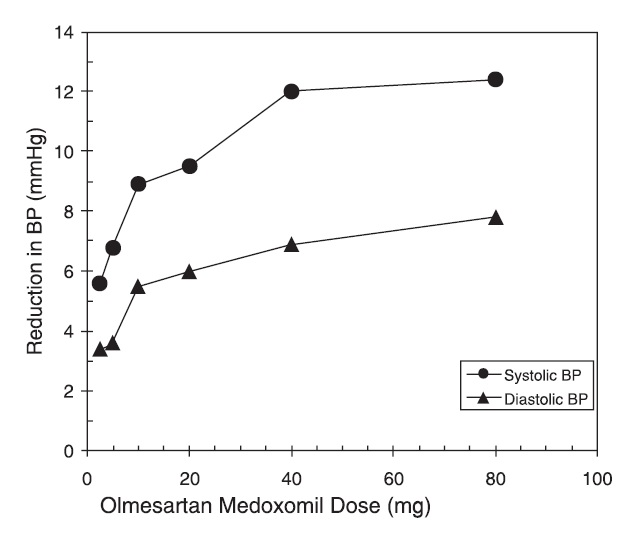
This text appears to be a graph or chart showing the reduction in blood pressure (BP) in millimeters of mercury (mmHg). The chart seems to be related to the dosage of a medication called Olmesartan Medoxomil, which is represented on the x-axis in milligrams (mg). The y-axis likely represents the systolic and diastolic blood pressure values, but specific values are not visible in the given text.*