Rabeprazole Sodium Tablet, Delayed Release
Product Images NDC 50090-6887

View Photos of Packaging, Regulatory Labels, and Product Appearance

Product Visual Gallery

This gallery contains 6 technical images submitted to the FDA as part of the official labeling for Rabeprazole Sodium (NDC 50090-6887). Unlike standard consumer photos, these assets often include clinical data figures, molecular chemical structures, and official manufacturer packaging layouts.

As provided by A-s Medication Solutions, these visuals offer a comprehensive scientific overview of the product's physical and chemical identity, aiding pharmacists and researchers in product verification and study.

FDA Label Image

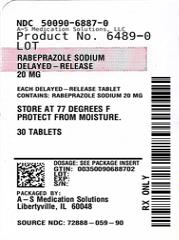
Label Image (Lbl500906887)
Label Image (Lbl500906887)
Label for RABEPRAZOLE SODIUM delayed-release tablets, 20 mg strength, oral route, packaged by A-S Medication Solutions in Libertyville, IL. The label states storage instructions to keep at 77 degrees Fahrenheit and protect from moisture. The package contains 30 tablets. The NDC is 50090-6887-0.*
FDA Label Image

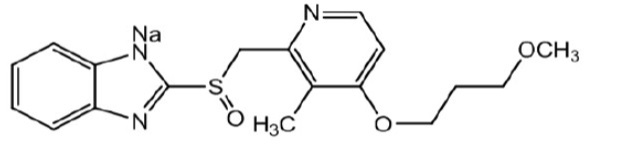
Structural Image (Rabeprazole Dr Tablet 01)

Structural Image (Rabeprazole Dr Tablet 01)
Chemical structure of rabeprazole sodium, the active ingredient in the medication RABEPRAZOLE SODIUM 20 mg delayed release oral tablets by A-S Medication Solutions.*
FDA Label Image

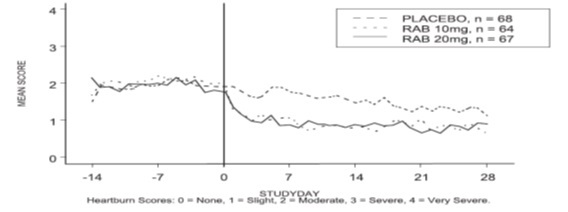
Figure 2: Mean Daytime Heartburn Scores Rab-usa-2 (Rabeprazole Dr Tablet 02)

Figure 2: Mean Daytime Heartburn Scores Rab-usa-2 (Rabeprazole Dr Tablet 02)
A line graph showing mean heartburn scores over a 28-day study period comparing placebo, 10 mg rabeprazole, and 20 mg rabeprazole groups. The x-axis represents study days, including a pre-study baseline period, and the y-axis represents heartburn severity scores from 0 (none) to 4 (very severe). The graph illustrates a trend of decreasing heartburn scores after day 0 for all groups, with differences noted among treatments.*
FDA Label Image

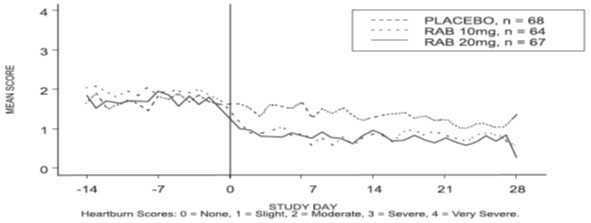
Figure 3: Mean Nighttime Heartburn Scores Rab-usa-2 (Rabeprazole Dr Tablet 03)

Figure 3: Mean Nighttime Heartburn Scores Rab-usa-2 (Rabeprazole Dr Tablet 03)
A line chart comparing mean heartburn scores over a 28-day study period for three groups: placebo, rabeprazole 10 mg, and rabeprazole 20 mg. The x-axis represents study days ranging from -14 to 28, while the y-axis shows mean heartburn scores from 0 (none) to 4 (very severe). A vertical line at day 0 indicates the start of treatment, with scores generally decreasing for rabeprazole groups post-treatment.*
FDA Label Image

Figure 4: Mean Daytime Heartburn Scores Rab-usa-3 (Rabeprazole Dr Tablet 04)

Figure 4: Mean Daytime Heartburn Scores Rab-usa-3 (Rabeprazole Dr Tablet 04)
A line graph showing mean heartburn scores over time for two groups: placebo (n=58) and rabeprazole sodium 20 mg (n=59). The x-axis represents study days from -14 to 28, and the y-axis shows mean heartburn scores from 0 (none) to 4 (very severe). The solid line represents rabeprazole sodium, and the dashed line represents placebo, with a vertical line at day 0 indicating the start of treatment.*
FDA Label Image

Figure 5: Mean Nighttime Heartburn Scores Rab-usa-3 (Rabeprazole Dr Tablet 05)

Figure 5: Mean Nighttime Heartburn Scores Rab-usa-3 (Rabeprazole Dr Tablet 05)
A line graph comparing mean heartburn scores over a study period between two groups: placebo (n=58) and rabeprazole sodium 20 mg (n=59). The x-axis represents study days from -14 to 28, and the y-axis shows mean heartburn scores from 0 (none) to 4 (very severe). The graph illustrates changing heartburn severity over time for both groups.*

* About these descriptions: Image descriptions on this page are generated by automated AI analysis of the product label images from the manufacturer's FDA label submission (SPL). They are provided for reference only and may contain errors or omissions. Always rely on the printed label itself and the official FDA labeling, and consult a pharmacist or healthcare professional with any questions about this product.