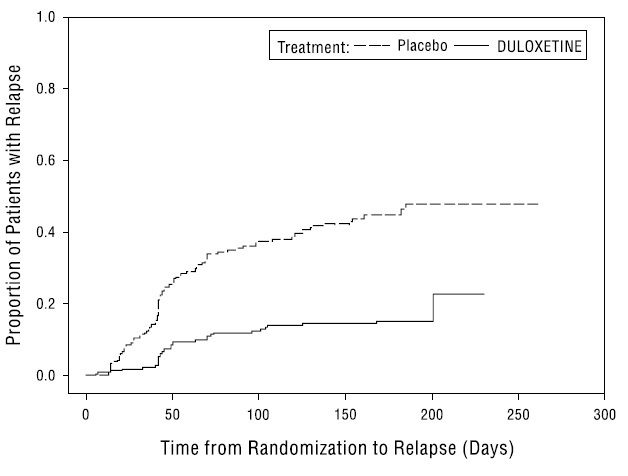
Figure1 (Duloxetine Fig1)
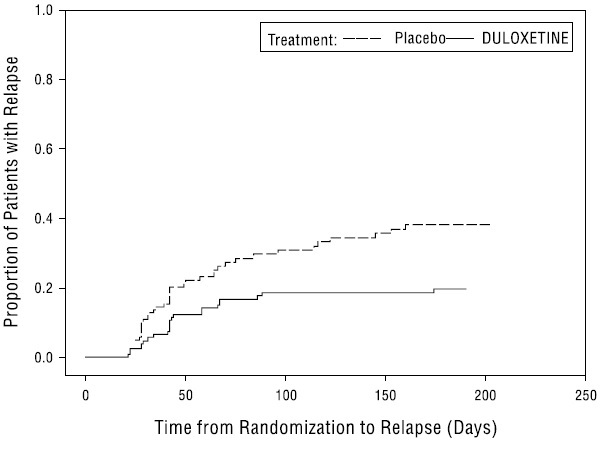
This text appears to be a graph presenting data on the time from randomization to relapse for patients receiving either a placebo or duloxetine treatment. The x-axis represents the time in days (ranging from 100 to 250), and the y-axis represents the number of patients with relapse. The data points are not available, as only the axis labels and treatment names are visible in the text.*