Product Images Atorvastatin Calcium

View Photos of Packaging, Labels & Appearance

Product Label Images

The following 5 images provide visual information about the product associated with Atorvastatin Calcium NDC 50090-6970 by A-s Medication Solutions, such as packaging, labeling, and the appearance of the drug itself. This resource could be helpful for medical professionals, pharmacists, and patients seeking to verify medication information and ensure they have the correct product.

atorvastatin-figure-01 - atorvastatin figure 01

atorvastatin-figure-01 - atorvastatin figure 01

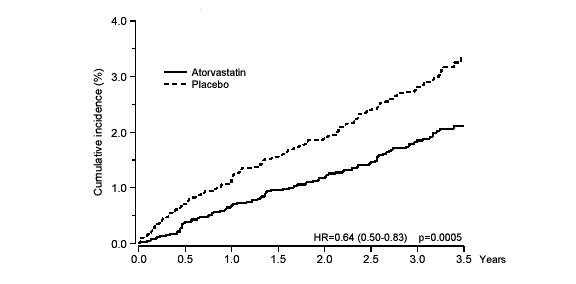
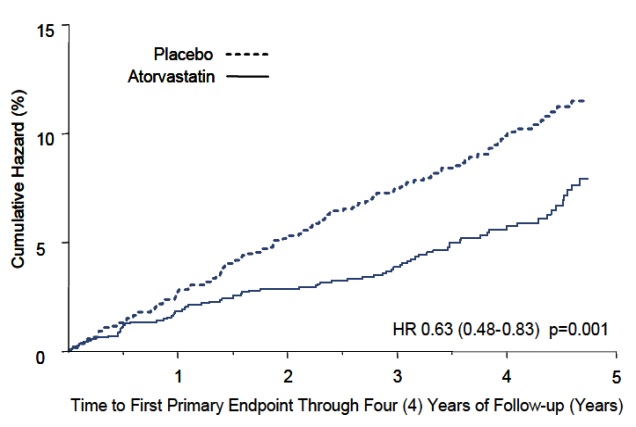
Cumulative incidence is a measure of the probability of developing a particular condition or event over a specified period of time. In this case, the text provides a list of cumulative incidence percentages at different time intervals. The text also mentions "Atovastatin" and "Placebo," which could possibly be related to a comparison of the effects of these two treatments on the cumulative incidence. However, without further context or information, it is difficult to provide a more specific description.*

atorvastatin-figure-02 - atorvastatin figure 02

atorvastatin-figure-02 - atorvastatin figure 02

atorvastatin-figure-03 - atorvastatin figure 03

atorvastatin-figure-03 - atorvastatin figure 03

This text appears to be a medical evaluation related to a medication called Atorvastatin. It includes information about two different dosages (10 mg and 80 mg) of the medication. The numerical values "HRO0.78 (0.69-0.89) P=0.0002" seem to be statistical measurements or results. The phrase "Time to First Major Cardiovascular Endpoint (Years)" suggests that the evaluation may be measuring the effectiveness of Atorvastatin in preventing cardiovascular events. Overall, this text provides limited information and context, but it relates to the evaluation of Atorvastatin and its impact on cardiovascular health.*

structure - atorvastatin structure

structure - atorvastatin structure

Label Image - lbl500906970

Label Image - lbl500906970

* The product label images have been analyzed using a combination of traditional computing and machine learning techniques. It should be noted that the descriptions provided may not be entirely accurate as they are experimental in nature. Use the information in this page at your own discretion and risk.