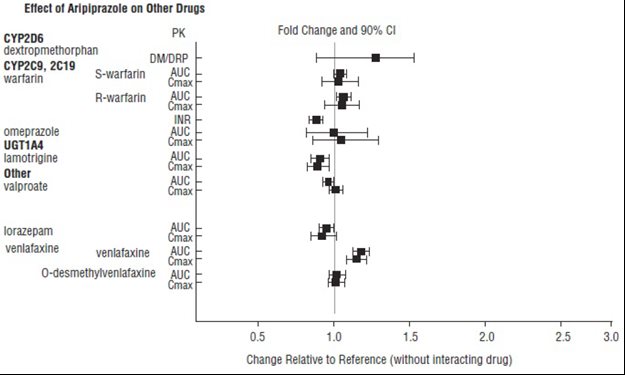
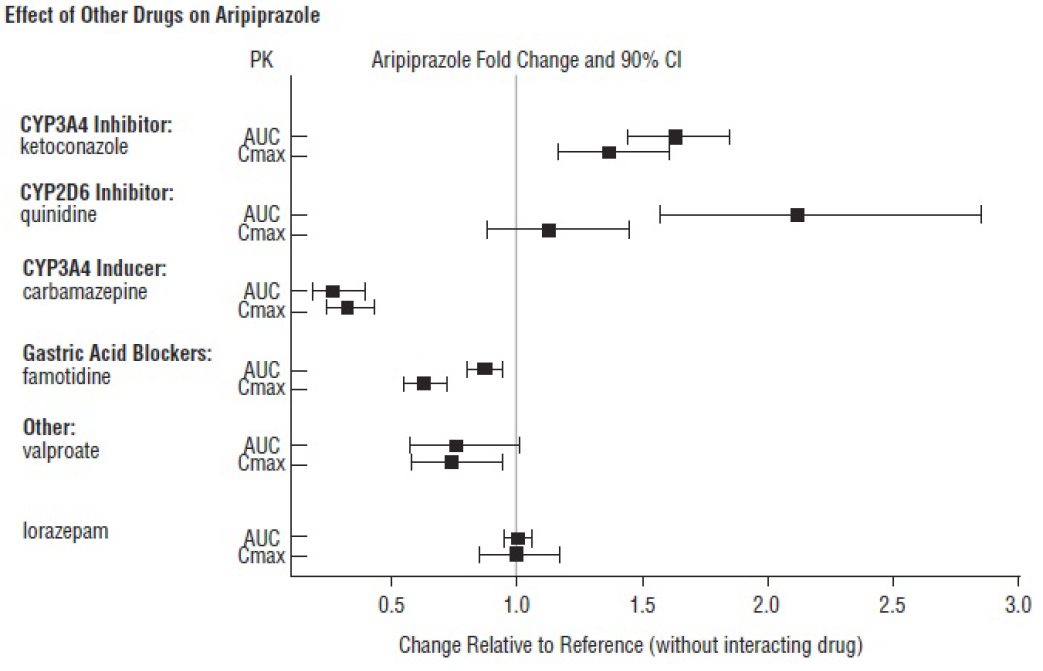
Figure2 (2f5cad93 Figure 02)
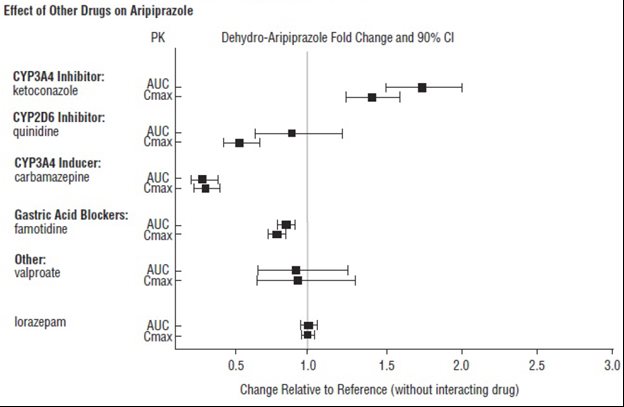
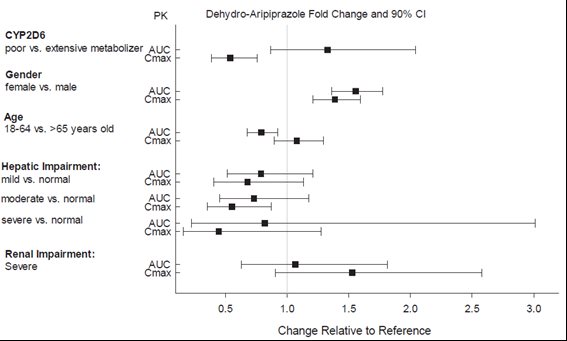
This text provides information on the effect of certain drugs on aripiprazole metabolism, including inhibitors like ketoconazole and quinidine, an inducer like carbamazepine, and other medications like famotidine, valproate, and lorazepam. It also mentions parameters like PK, AUC, and Cmax, and provides data on the dehydro-aripiprazole fold change.*