Gabapentin Capsule
Product Images NDC 50090-7169

View Photos of Packaging, Regulatory Labels, and Product Appearance

Product Visual Gallery

This gallery contains 6 technical images submitted to the FDA as part of the official labeling for Gabapentin (NDC 50090-7169). Unlike standard consumer photos, these assets often include clinical data figures, molecular chemical structures, and official manufacturer packaging layouts.

As provided by A-s Medication Solutions, these visuals offer a comprehensive scientific overview of the product's physical and chemical identity, aiding pharmacists and researchers in product verification and study.

FDA Label Image

Gabapentin-equation (Gabapentin Equation)

Gabapentin-equation (Gabapentin Equation)
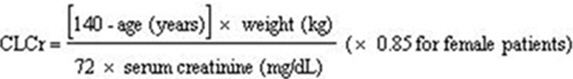
This text appears to be a medical record showing a calculation related to body weight, serum creatinine levels, and a correction factor for female patients. The data provided includes a numerical value related to years, weight in kilograms, serum creatinine level in milligrams per deciliter, and a correction factor for female patients related to chloride levels.*
FDA Label Image

Gabapentin-fig1 (Gabapentin Fig1)

Gabapentin-fig1 (Gabapentin Fig1)
This text provides information about a study comparing the mean pain score between a placebo group and a group taking 3600 mg/day of Gabapentin. The study had a 4-week dose titration period followed by a 4-week fixed dose period. The baseline pain score was 10.*
FDA Label Image

Gabapentin-fig2 (Gabapentin Fig2)

Gabapentin-fig2 (Gabapentin Fig2)
This text provides information about pain scores and different doses of medications tested over a period of weeks, ranging from placebo to various doses of Gabapentin (1800 mg/day and 2400 mg/day). The data seems to be related to a study or clinical trial evaluating the effects of these medications on pain.*
FDA Label Image

Gabapentin-fig3 (Gabapentin Fig3)

Gabapentin-fig3 (Gabapentin Fig3)
This text seems to represent a data table showing the proportion of responders in Controlled PHN Studies for different treatment groups. The table includes percentages for different studied treatments, such as GBP 3600, GBP 1800, GBP 2400, and PBO (Placebo). It also mentions that the proportion of responders with at least a 50% reduction in pain score at the endpoint of the study is shown. The table contains various percentages ranging from 29% to 10%, along with statistical symbols like #p<00l and < 0.001.*
FDA Label Image

Gabapentin-fig4.jpg (Gabapentin Fig4)

FDA Label Image

Label Image (Lbl500907169)

* These product label images have been analyzed using experimental machine learning. Please verify findings with the primary label text.