Lurasidone Hydrochloride Tablet, Film Coated
Product Images NDC 50090-7170

View Photos of Packaging, Regulatory Labels, and Product Appearance

Product Visual Gallery

This gallery contains 5 technical images submitted to the FDA as part of the official labeling for Lurasidone Hydrochloride (NDC 50090-7170). Unlike standard consumer photos, these assets often include clinical data figures, molecular chemical structures, and official manufacturer packaging layouts.

As provided by A-s Medication Solutions, these visuals offer a comprehensive scientific overview of the product's physical and chemical identity, aiding pharmacists and researchers in product verification and study.

FDA Label Image

Label Image (Lbl500907170)

Label Image (Lbl500907170)
Label for lurasidone hydrochloride 20 mg film-coated tablets, manufactured by A-S Medication Solutions. It states that each tablet contains 20 mg of lurasidone HCl, equivalent to 18.62 mg of lurasidone. The label includes storage instructions to keep at 77 degrees Fahrenheit and shows a package size of 30 tablets. Additional product identifiers such as lot number and NDC 50090-7170-0 are visible.*
FDA Label Image

Lurasidone-structure (Lurasidone 1)

Lurasidone-structure (Lurasidone 1)
Chemical structure of lurasidone hydrochloride, illustrating its molecular framework including ring systems and functional groups labeled with atoms and bonds.*
FDA Label Image

Lurasidone-fig2 (Lurasidone Fig2)

Lurasidone-fig2 (Lurasidone Fig2)
A chart titled 'Impact of other drugs on Lurasidone Pharmacokinetics (PK)' showing fold change and 90% confidence intervals for Cmax and AUC parameters when lurasidone is taken with various interacting drugs. The drugs include strong CYP3A4 inhibitors (Ketoconazole 400 mg/day), moderate CYP3A4 inhibitors (Diltiazem 240 mg/day), and strong CYP3A4 inducers (Rifampin 600 mg/day) as well as Lithium 600 mg BID. The x-axis represents change relative to lurasidone alone, ranging from -4 to 4.*
FDA Label Image

Lurasidone-fig2 (Lurasidone Fig3)

Lurasidone-fig2 (Lurasidone Fig3)
A forest plot chart illustrating fold change and 90% confidence intervals for pharmacokinetic parameters (Cmax, AUC, trough) of various interacting drugs including digoxin, midazolam, ethinyl estradiol, norelgestromin, and lithium when compared to the interactive drug alone. The x-axis represents change relative to the interactive drug alone from -1.0 to 1.0.*
FDA Label Image

Lurasidone-fig3 (Lurasidone Fig4)

Lurasidone-fig3 (Lurasidone Fig4)
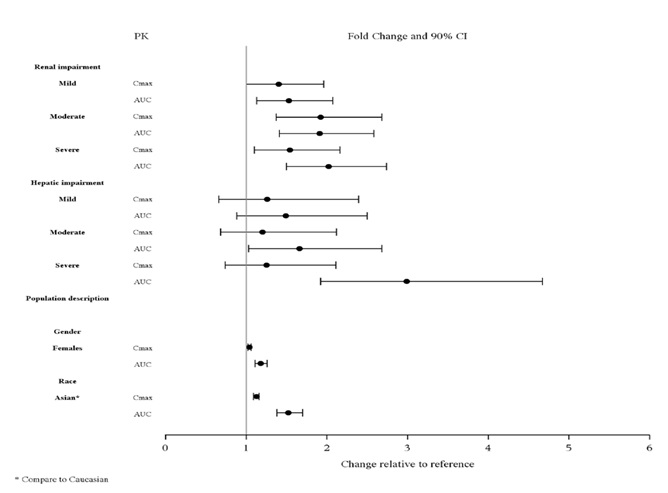
A scatter plot chart displaying pharmacokinetic (PK) fold changes and 90% confidence intervals (CI) of Cmax and AUC across different groups. Categories include renal impairment (mild, moderate, severe), hepatic impairment (mild, moderate, severe), and population descriptors (gender: females; race: Asian compared to Caucasian). The x-axis shows change relative to reference, ranging from 0 to 6.*

* About these descriptions: Image descriptions on this page are generated by automated AI analysis of the product label images from the manufacturer's FDA label submission (SPL). They are provided for reference only and may contain errors or omissions. Always rely on the printed label itself and the official FDA labeling, and consult a pharmacist or healthcare professional with any questions about this product.