Insulin Degludec Injection, Solution
Product Images NDC 50090-7175
View Photos of Packaging, Regulatory Labels, and Product Appearance
Product Visual Gallery
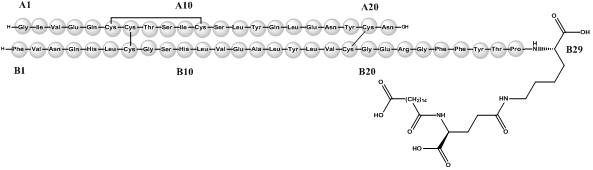
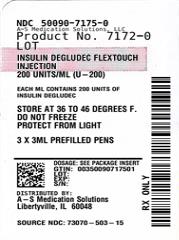
This gallery contains 61 technical images submitted to the FDA as part of the official labeling for Insulin Degludec (NDC 50090-7175). Unlike standard consumer photos, these assets often include clinical data figures, molecular chemical structures, and official manufacturer packaging layouts.
As provided by A-s Medication Solutions, these visuals offer a comprehensive scientific overview of the product's physical and chemical identity, aiding pharmacists and researchers in product verification and study.
Product Images & Figures Index
Figure 2: Mean Gir Profile For 0.4 U/kg Dose Of Tresiba (steady State) In Patients With Type 1 Diabetes Mellitus (Image 02)
This is a data table showing the time since injection in hours, with data points at 0, 6, 12, 18, and 24 hours. It appears to be related to a treatment involving 0.4 U per kg dosage. The information seems to be related to a study or experiment, though additional context is needed for a more detailed interpretation.*
Vial Ifu-1 (Image 03)
Vial Ifu-2 (Image 04)
Vial Ifu-figure A,b (Image 05)
Vial Ifu-figure C (Image 06)
Vial Ifu-figure D (Image 07)
Vial Ifu-figure E (Image 08)
Vial Ifu-figure F (Image 09)
Vial Ifu-figure G (Image 10)
Vial Ifu-figure H (Image 11)
Vial Ifu-figure I (Image 12)
Vial Ifu-figure J (Image 13)
Vial Ifu-figure K (Image 14)
Vial Ifu-figure L (Image 15)
Figure A: Novofine Needle Components (Image 16)
Figure A: Novotwist Needle Components (Image 17)
Figure A (Image 18)
100 U/ml Ifu (Figure B)
100 U/ml Ifu (Figure C)
100 U/ml Ifu (Figure D)
100 U/ml Ifu (Figure E)
100 U/ml Ifu (Figure F)
100 U/ml Ifu (Figure G)
100 U/ml Ifu (Figure H)
100 U/ml Ifu (Figure I)
100 U/ml Ifu (Figure J)
100 U/ml Ifu (Figure K)
100 U/ml Ifu (Figure L)
100 U/ml Ifu (Figure M)
100 U/ml Ifu (Figure N)
100 U/ml Ifu (Figure O)
100 U/ml Ifu (Figure P)
100 U/ml Ifu (Figure Q)
100 U/ml Ifu (Figure R)
100 U/ml Ifu (Figure S)
100 U/ml Ifu (Figure T)
U200 Figure A (Image 38)
Figure A: Novofine Needle Components (Image 40)
Figure A: Novotwist Needle Components (Image 41)
200 U/ml Ifu Figure B (Image 43)
200 U/ml Ifu Figure C (Image 44)
200 U/ml Ifu Figure D (Image 45)
200 U/ml Ifu Figure E (Image 46)
200 U/ml Ifu Figure F (Image 47)
200 U/ml Ifu Figure G (Image 48)
200 U/ml Ifu Figure H (Image 49)
Figure 3 (Image 52)
200 U/ml Ifu Figure I (Image 53)
200 U/ml Ifu Figure J (Image 54)
200 U/ml Ifu Figure K (Image 55)
200 U/ml Ifu Figure L (Image 56)
200 U/ml Ifu Figure M (Image 57)
200 U/ml Ifu Figure N (Image 58)
200 U/ml Ifu Figure O (Image 59)
200 U/ml Ifu Figure P (Image 60)
200 U/ml Ifu Figure Q (Image 61)
200 U/ml Ifu Figure R (Image 62)
200 U/ml Ifu Figure S (Image 63)
200 U/ml Ifu Figure T (Image 64)
Label Image (Lbl500907175)
* These product label images have been analyzed using experimental machine learning. Please verify findings with the primary label text.