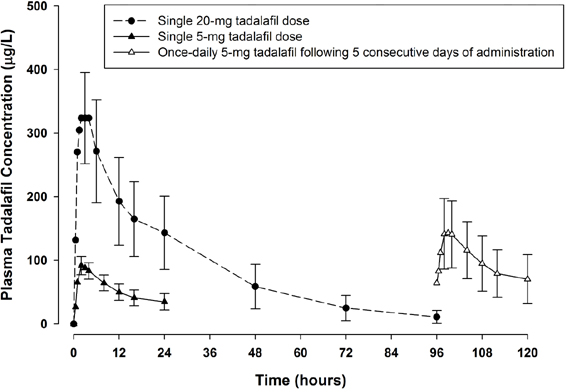
Label Image (Lbl500907314)
This text appears to showcase information about a product. It includes details such as "5 MG" contents and quantity ("90 TABLETS"). The text also mentions the product being available at a specific temperature of "77 DEGREES". The product code or label seems to be "1mc, zotpe" and "T ebr0-0 FRoacaFiL".*