Tadalafil Tablet, Film Coated
Product Images NDC 50090-7390

View Photos of Packaging, Regulatory Labels, and Product Appearance

Product Visual Gallery

This gallery contains 9 technical images submitted to the FDA as part of the official labeling for Tadalafil (NDC 50090-7390). Unlike standard consumer photos, these assets often include clinical data figures, molecular chemical structures, and official manufacturer packaging layouts.

As provided by A-s Medication Solutions, these visuals offer a comprehensive scientific overview of the product's physical and chemical identity, aiding pharmacists and researchers in product verification and study.

FDA Label Image

Label Image (Lbl500907390)

Label Image (Lbl500907390)
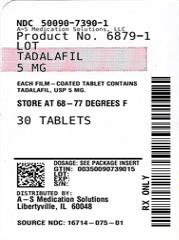
This is a product label for FRoacaFIL containing 5 MG strength tablets. It has a product number of 6879-1 and contains 30 tablets per package. The label also indicates "STonE AT 87 oeGaces ยข" as additional information.*
FDA Label Image

Spl-tadalafil-figure-1 (Spl Tadalafil Figure 1)

FDA Label Image

Spl-tadalafil-figure-2 (Spl Tadalafil Figure 2)

Spl-tadalafil-figure-2 (Spl Tadalafil Figure 2)
This is a table showing the standing and supine systolic blood pressure measurements (in mmHg) at various time points post-dose for individuals taking Tadalafil 20 mg & doxazosin 8 mg and Placebo & doxazosin 8 mg.*
FDA Label Image

Spl-tadalafil-figure-3 (Spl Tadalafil Figure 3)

Spl-tadalafil-figure-3 (Spl Tadalafil Figure 3)
This text appears to show different scenarios of dosing involving tadalafil and doxazosin at different times, with corresponding systolic blood pressure readings. The study or data presented may be evaluating the effects of these medications on blood pressure at different time points.*
FDA Label Image

Spl-tadalafil-figure-4 (Spl Tadalafil Figure 4)

Spl-tadalafil-figure-4 (Spl Tadalafil Figure 4)
This is a chart showing the plasma concentration of Tadalafil (in micrograms per liter) over time after various doses of the drug were administered. The chart compares the concentration levels after a single 20mg dose, a single 5mg dose, and a once-daily 5mg dose following 5 consecutive days of administration. The concentration levels start to rise after administration, peak at different points, and then slowly decrease over time. Each point on the chart represents the concentration of Tadalafil at specific time intervals in hours.*
FDA Label Image

Spl-tadalafil-figure-5 (Spl Tadalafil Figure 5)

Spl-tadalafil-figure-5 (Spl Tadalafil Figure 5)
This text provides data on the change from baseline in International Prostate Symptom Score (IPSS) total score for patients receiving Tadalafil 5 mg compared to placebo. The results indicate a statistically significant difference between the two groups (p<0.01). The text also references the duration of treatment in weeks.*
FDA Label Image

Spl-tadalafil-figure-6 (Spl Tadalafil Figure 6)

Spl-tadalafil-figure-6 (Spl Tadalafil Figure 6)
This text provides information on the change from baseline in IPSS Total Score for Tadalafil 5 mg compared to Placebo after 12 weeks of treatment. The note "* p<0.01" suggests statistical significance in the difference between the two groups.*
FDA Label Image

Spl-tadalafil-figure-8 (Spl Tadalafil Figure 8)

Spl-tadalafil-figure-8 (Spl Tadalafil Figure 8)
The text describes the change from the baseline in International Prostate Symptom Score (IPSS) total score after treatment with Tadalafil 5 mg compared to a placebo. The results show a statistically significant improvement in the IPSS total score for Tadalafil 5 mg compared to placebo at a p-value of less than 0.01 over the specified duration of treatment in weeks.*
FDA Label Image

Spl-tadalafil-structure (Spl Tadalafil Structure)

* These product label images have been analyzed using experimental machine learning. Please verify findings with the primary label text.