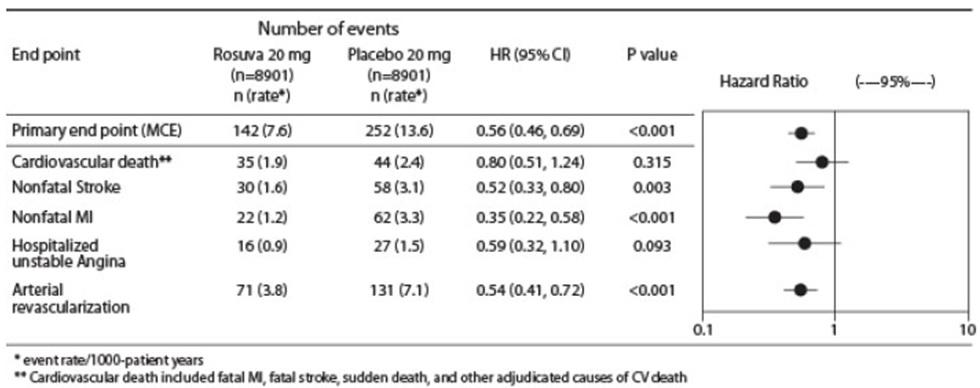
Figure-01 (Figure 1)

This is a statistical data table displaying the results of a research study comparing an intervention (RSV) with a control group (Placebo). The results include Hazard Ratios (HR), 95% Confidence Intervals (CI), p-values, and the number of cases at risk over different years. The data indicates a significant difference between the two groups.*