Desvenlafaxine Tablet, Extended Release
Product Images NDC 50090-7737

View Photos of Packaging, Regulatory Labels, and Product Appearance

Product Visual Gallery

This gallery contains 7 technical images submitted to the FDA as part of the official labeling for Desvenlafaxine (NDC 50090-7737). Unlike standard consumer photos, these assets often include clinical data figures, molecular chemical structures, and official manufacturer packaging layouts.

As provided by A-s Medication Solutions, these visuals offer a comprehensive scientific overview of the product's physical and chemical identity, aiding pharmacists and researchers in product verification and study.

FDA Label Image

Image Description (Desvenlafaxine Tablets Figure 1)
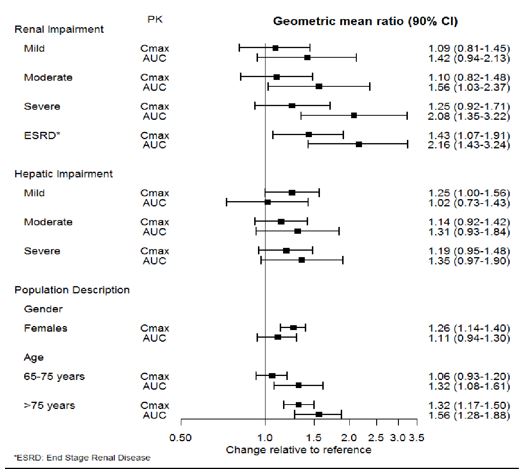
Image Description (Desvenlafaxine Tablets Figure 1)
A forest plot chart illustrating the geometric mean ratio (90% confidence interval) for Cmax and AUC pharmacokinetic parameters of desvenlafaxine in populations with renal impairment (mild to ESRD), hepatic impairment (mild to severe), and demographic groups (female gender and age groups 65-75 and over 75 years). The X-axis represents change relative to reference, ranging from 0.5 to 3.5.*
FDA Label Image

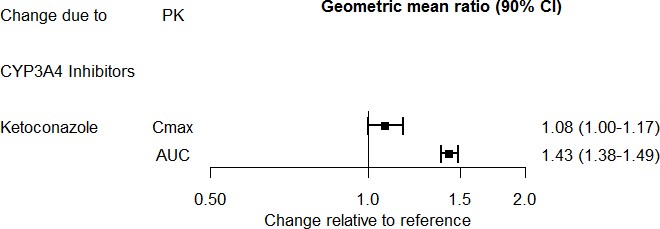
Image Description (Desvenlafaxine Tablets Figure 2)

Image Description (Desvenlafaxine Tablets Figure 2)
A chart showing the geometric mean ratio with 90% confidence intervals for pharmacokinetic changes in DESVENLAFAXINE due to CYP3A4 inhibitors, specifically Ketoconazole. The chart compares Cmax and AUC values, illustrating change relative to a reference value on a horizontal axis ranging from 0.50 to 2.0.*
FDA Label Image

Image Description (Desvenlafaxine Tablets Figure 3)

Image Description (Desvenlafaxine Tablets Figure 3)
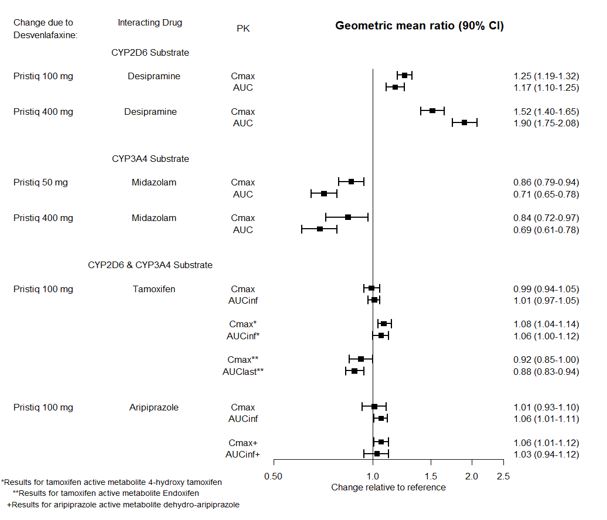
A chart depicting the geometric mean ratios with 90% confidence intervals for pharmacokinetic parameters (Cmax, AUC, AUCinf, AUClast) showing interactions between desvenlafaxine and various drugs including Desipramine, Midazolam, Tamoxifen, and Aripiprazole at different dosages. The chart compares changes relative to a reference for CYP2D6 and CYP3A4 substrates.*
FDA Label Image

Image Description (Desvenlafaxine Tablets Figure 4)

Image Description (Desvenlafaxine Tablets Figure 4)
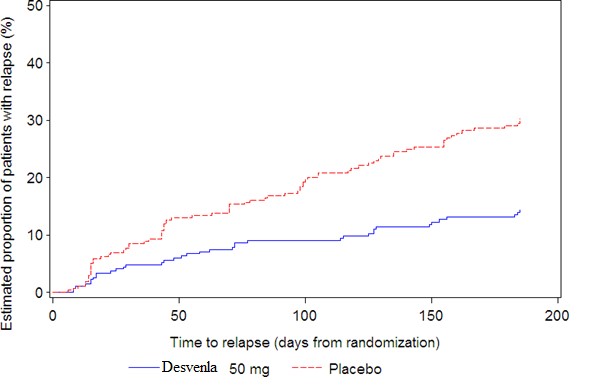
A line graph showing the estimated proportion of patients with relapse (%) over time (days from randomization) comparing Desvenlafaxine 50 mg (solid blue line) and Placebo (dashed red line). The graph indicates a lower relapse rate over time for Desvenlafaxine 50 mg compared to Placebo up to approximately 190 days.*
FDA Label Image

Image Description (Desvenlafaxine Tablets Figure 5)

Image Description (Desvenlafaxine Tablets Figure 5)
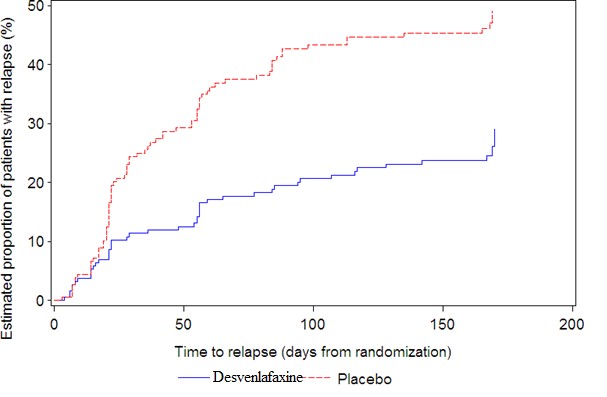
A Kaplan-Meier curve chart showing the estimated proportion of patients with relapse (%) over time in days from randomization. The graph compares relapse rates between Desvenlafaxine (solid blue line) and a placebo group (dashed red line), with the placebo group showing a higher proportion of relapse over time.*
FDA Label Image

Image Description (Desvenlafaxine Tablets Structure)

Image Description (Desvenlafaxine Tablets Structure)
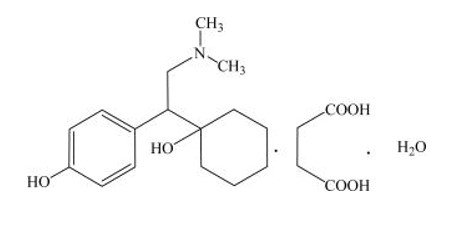
Chemical structure of desvenlafaxine, showing its molecular framework including phenol, cyclohexanol, and dimethylamine groups along with a water molecule.*
FDA Label Image

Label Image (Lbl500907737)

Label Image (Lbl500907737)
DESVENLAFAXINE 50 mg extended-release tablets label from A-S Medication Solutions. The label states each film-coated extended-release tablet contains 50 mg desvenlafaxine succinate, equivalent to 36 mg desvenlafaxine free base. The package contains 30 tablets and includes storage instructions to store at 68 to 77 degrees Fahrenheit.*

* About these descriptions: Image descriptions on this page are generated by automated AI analysis of the product label images from the manufacturer's FDA label submission (SPL). They are provided for reference only and may contain errors or omissions. Always rely on the printed label itself and the official FDA labeling, and consult a pharmacist or healthcare professional with any questions about this product.