Label Image (Lbl500907768)
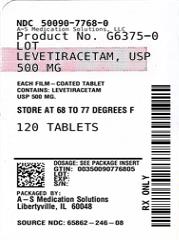
This is a product label with information about the medication. The product is Telerace Tan, which contains 560mg strength and comes in a pack of 120 tablets. The product number is "66375-0".*