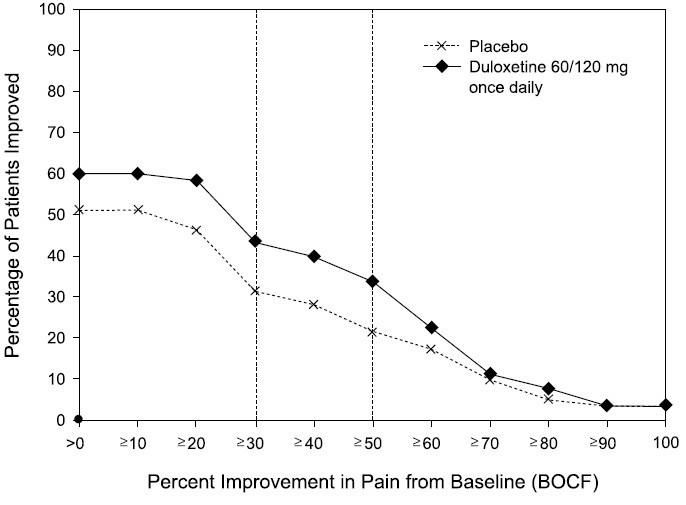
Figure1 (Duloxetine Fig1)

This is a table displaying the number of patients with relapse over time for the treatment groups of placebo and duloxetine. The x-axis represents the time from randomization to relapse in days, while the y-axis shows the number of patients. The data seems to be measured at different time intervals up to 250 days.*