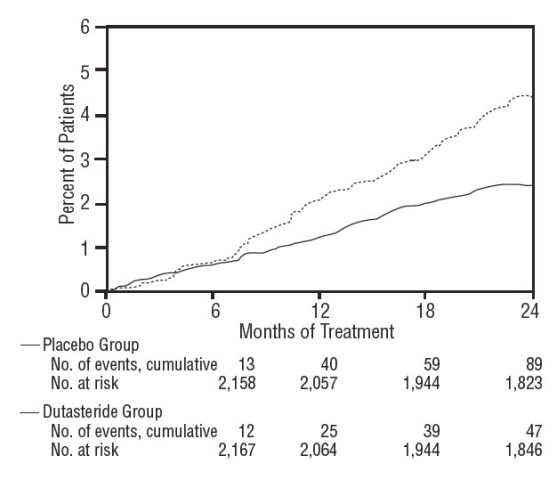
Dutasteride Capsule, Liquid Filled
Product Images NDC 50090-7852
View Photos of Packaging, Regulatory Labels, and Product Appearance
Product Visual Gallery
This gallery contains 9 technical images submitted to the FDA as part of the official labeling for Dutasteride (NDC 50090-7852). Unlike standard consumer photos, these assets often include clinical data figures, molecular chemical structures, and official manufacturer packaging layouts.
As provided by A-s Medication Solutions, these visuals offer a comprehensive scientific overview of the product's physical and chemical identity, aiding pharmacists and researchers in product verification and study.
Figure-2 (Figure 2)
This text provides information on the percent of patients experiencing events over time in two different groups (Placetbo and Dutasteride) during months of treatment. The number of events and patients at risk are presented at various time points, offering insights into the progression of the event occurrence in each group.*
Figure-3 (Figure 3)
Figure-4 (Figure 4)
This text provides information on the mean percent change from baseline over different months of treatment with placebo and dutasteride. The sample sizes for each group are also noted. This data can be used to evaluate the effectiveness of dutasteride compared to placebo in inducing changes over time.*
Figure-5 (Figure 5)
Figure-6 (Figure 6)
This information appears to be a table detailing the number of participants for different treatments. It includes treatments such as Dutasteride + tamsulosin, Dutasteride 0.5 mg, and Tamsulosin 0.4 mg, with corresponding participant counts. The table also includes 7 numbered rows with various symbols like "@" and "&" preceding them. The table seems to be related to different treatment durations as it involves month values (0, 12, 24, 36, 48) next to the symbol rows.*
Figure-7 (Figure 7)
This text appears to be a table showing the number of participants for different treatments (A Dutasteride + tamsulosin, Dutasteride 0.5 mg, Tamsulosin 0.4 mg) over several months of treatment. The table includes participant numbers for each treatment option at different time intervals. The data seems to be arranged in a structured manner for comparison and analysis.*
Structural-formula (Image 01)
Label Image (Lbl500907852)
* These product label images have been analyzed using experimental machine learning. Please verify findings with the primary label text.