Sildenafil Tablet, Film Coated
Product Images NDC 50090-7964

View Photos of Packaging, Regulatory Labels, and Product Appearance

Product Visual Gallery

This gallery contains 9 technical images submitted to the FDA as part of the official labeling for Sildenafil (NDC 50090-7964). Unlike standard consumer photos, these assets often include clinical data figures, molecular chemical structures, and official manufacturer packaging layouts.

As provided by A-s Medication Solutions, these visuals offer a comprehensive scientific overview of the product's physical and chemical identity, aiding pharmacists and researchers in product verification and study.

FDA Label Image

Label Image (Lbl500907964)

Label Image (Lbl500907964)
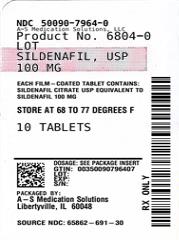
This appears to be a product description for a packet containing 16 tablets with the product number 6804-0. The text mentions a "use scenario" or instructions for use, possibly for a medication or supplement.*
FDA Label Image

Figure 1 (Sildenafil Fig1)

Figure 1 (Sildenafil Fig1)
This text provides information related to blood pressure measurements before and after the administration of sildenafil to healthy volunteers. The data includes systolic blood pressure values at different time points and the change from the baseline. It appears to be part of a study or medical report.*
FDA Label Image

Figure 2 (Sildenafil Fig2)

Figure 2 (Sildenafil Fig2)
This is a chart showing the change in systolic blood pressure (SBP) in mmHg over time after taking different medications. The medications compared are Doxazosin + Placebo and Doxazosin + Sildenafil 25 mg. The chart illustrates how the standing systolic blood pressure changes from the baseline at different time intervals postdose.*
FDA Label Image

Figure 3 (Sildenafil Fig3)

FDA Label Image

Figure 4 (Sildenafil Fig4)

Figure 4 (Sildenafil Fig4)
This is a figure showing the mean standing systolic blood pressure change from baseline in a study comparing the combination of Doxazosin and Sildenafil 100 mg against the combination of Doxazosin and Placebo over a period of time after dosing.*
FDA Label Image

Figure 5 (Sildenafil Fig5)

Figure 5 (Sildenafil Fig5)
This is a table showing mean Sildenafil plasma concentrations in healthy male volunteers over time after taking a commercial tablet. The data is plotted at different time points post-dose in hours.*
FDA Label Image

Figure 6. Effect Of Sildenafil And Placebo On Maintenance Of Erection By Baseline Score (Sildenafil Fig6)

FDA Label Image

Sildenafile Fig 7 (Sildenafil Fig7)

FDA Label Image

Structure (Sildenafil Str)

* These product label images have been analyzed using experimental machine learning. Please verify findings with the primary label text.