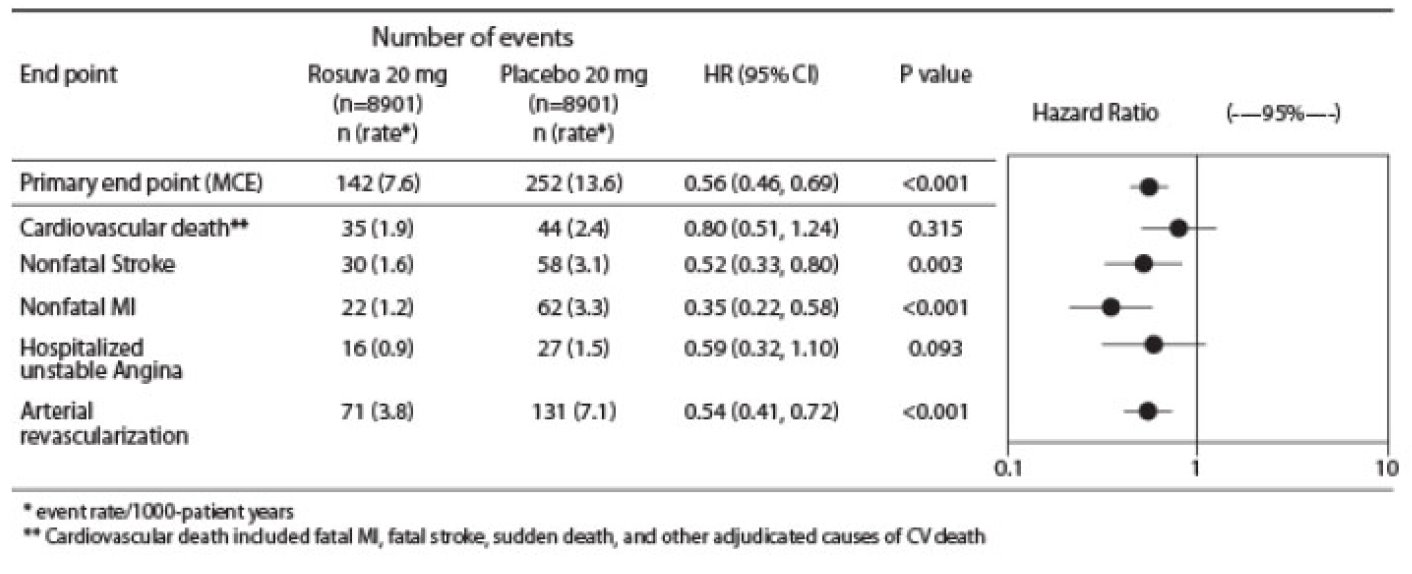
Figure1 (Figure1)
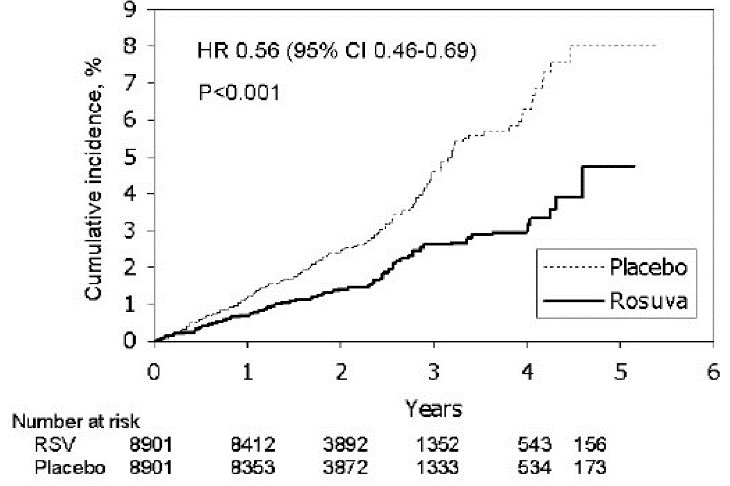
This is a statistical analysis output of a study comparing the hazard ratio (HR) of two groups, possibly a treatment group (Rosuvastatin) and a control group (Placebo). The hazard ratio is 0.56 with a 95% confidence interval of 0.46-0.69, indicating a significant difference between the two groups (P<0.001). The table also shows the cumulative incidence in percentages for each group over time. The number at risk is provided for each time point in the study for both the Rosuvastatin and Placebo groups.*