Estradiol / Norethindrone Acetate Tablet, Film Coated
Product Images NDC 50090-8003

View Photos of Packaging, Regulatory Labels, and Product Appearance

Product Visual Gallery

This gallery contains 11 technical images submitted to the FDA as part of the official labeling for Estradiol / Norethindrone Acetate (NDC 50090-8003). Unlike standard consumer photos, these assets often include clinical data figures, molecular chemical structures, and official manufacturer packaging layouts.

As provided by A-s Medication Solutions, these visuals offer a comprehensive scientific overview of the product's physical and chemical identity, aiding pharmacists and researchers in product verification and study.

FDA Label Image

Label Image (Lbl500908003)
Label Image (Lbl500908003)
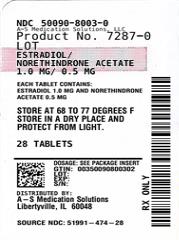
The image shows a label for Estradiol / Norethindrone Acetate tablets, film-coated, with a strength of 1.0 mg/0.5 mg per tablet. The label indicates the product is manufactured by A-S Medication Solutions and packaged as 28 tablets. Storage instructions specify 68 to 77 degrees F, in a dry place, protected from light.*
FDA Label Image

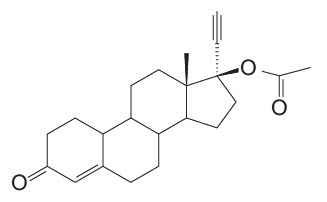
Chemical Structure (Norethindrone 01)

Chemical Structure (Norethindrone 01)
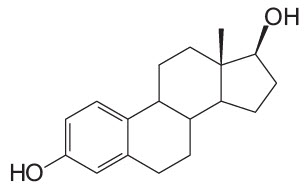
Chemical structure of estradiol, one of the active ingredients in the Estradiol / Norethindrone Acetate tablet. The diagram shows the molecular arrangement including hydroxyl groups characteristic of estradiol.*
FDA Label Image

Chemical Structure (Norethindrone 02)

Chemical Structure (Norethindrone 02)
Chemical structure diagram of Estradiol and Norethindrone Acetate, showing the molecular framework common to these steroid hormones.*
FDA Label Image

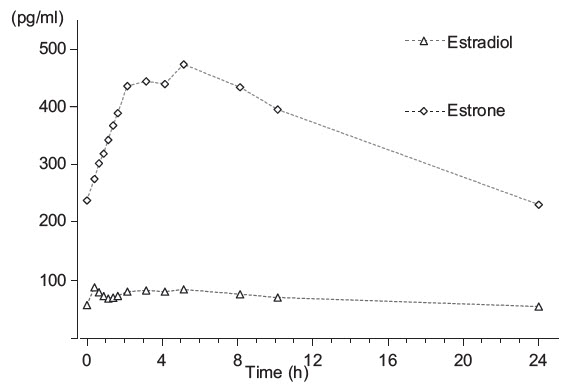
Figure 1a (Norethindrone 03)

Figure 1a (Norethindrone 03)
A line graph showing plasma concentrations (pg/ml) of Estradiol and Estrone over 24 hours. The x-axis represents time in hours, and the y-axis shows concentration levels. Estrone concentration peaks around 4 hours then gradually declines, while Estradiol remains relatively stable at lower levels throughout the period.*
FDA Label Image

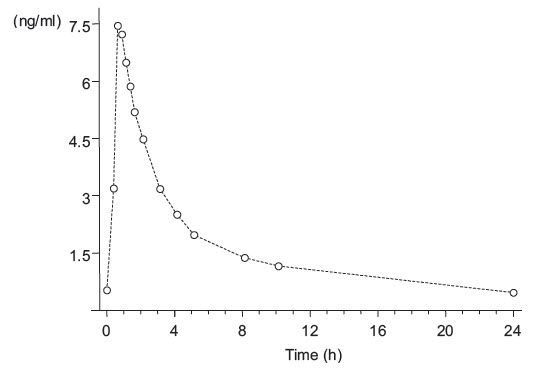
Figure 1b (Norethindrone 04)

Figure 1b (Norethindrone 04)
A line graph depicting concentration (ng/ml) over time (hours) with data points plotted from 0 to 24 hours. The graph shows a peak concentration near 1 hour followed by a gradual decline over the 24-hour period.*
FDA Label Image

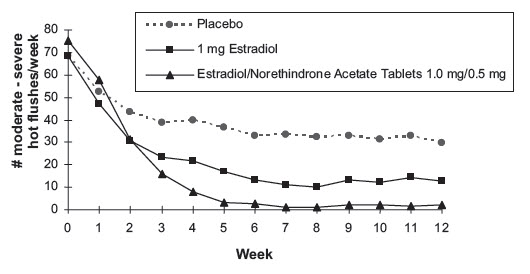
Figure 2 (Norethindrone 05)

Figure 2 (Norethindrone 05)
Line graph comparing the number of moderate to severe hot flushes per week over 12 weeks for three treatments: Placebo, 1 mg Estradiol, and Estradiol/Norethindrone Acetate Tablets 1.0 mg/0.5 mg. The graph shows a rapid decrease in hot flushes for the active treatments compared to placebo over time.*
FDA Label Image

Figure 3 (Norethindrone 06)

Figure 3 (Norethindrone 06)
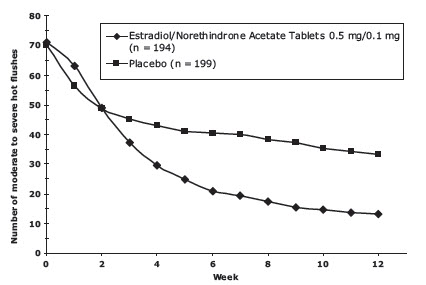
A line graph comparing the number of moderate to severe hot flushes over 12 weeks between Estradiol/Norethindrone Acetate Tablets 0.5 mg/0.1 mg and placebo groups. The x-axis represents weeks, and the y-axis indicates the number of hot flushes. The graph shows a marked reduction in hot flushes for the Estradiol/Norethindrone Acetate group compared to placebo.*
FDA Label Image

Figure 4 (Norethindrone 07)

Figure 4 (Norethindrone 07)
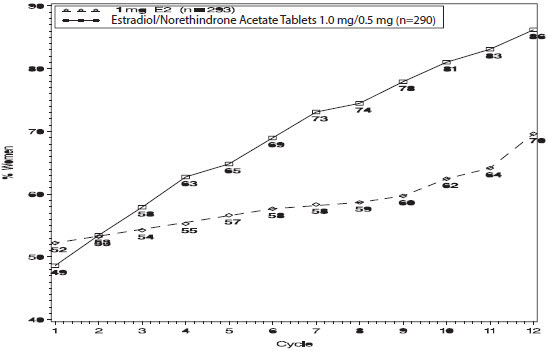
Line graph depicting % change over 12 cycles for Estradiol/Norethindrone Acetate Tablets 1.0 mg/0.5 mg and 1 mg E2 groups. The x-axis represents cycle numbers from 1 to 12, and the y-axis shows percentage change from about 40% to 90%. Data points with respective values are plotted for each group highlighting trends over time.*
FDA Label Image

Figure 5 (Norethindrone 08)

Figure 5 (Norethindrone 08)
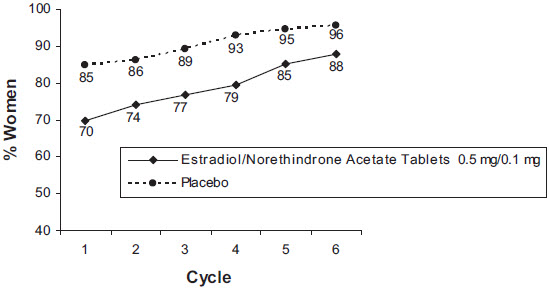
A line graph showing the percentage of women over six cycles taking either Estradiol/Norethindrone Acetate Tablets 0.5 mg/0.1 mg or placebo. The graph plots percentage on the vertical axis (ranging approximately from 40% to 100%) and cycle number on the horizontal axis from 1 to 6, comparing the two groups' responses over time.*
FDA Label Image

Figure 6 (Norethindrone 09)

Figure 6 (Norethindrone 09)
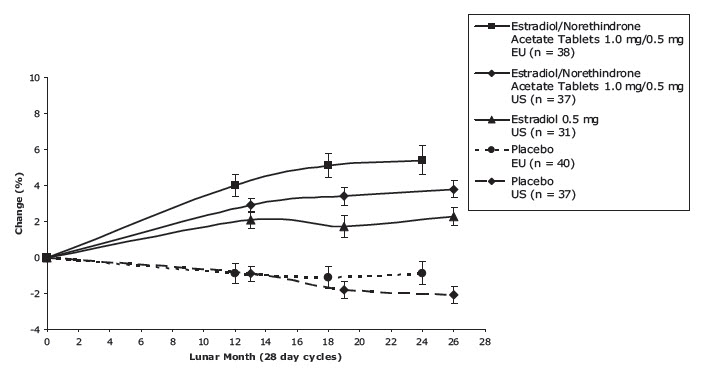
A line graph showing percentage change over lunar months (28-day cycles) for different groups: Estradiol/Norethindrone Acetate Tablets 1.0 mg/0.5 mg in EU and US, Estradiol 0.5 mg in US, and Placebo in EU and US. The graph includes error bars and distinguishes groups by different lines and markers, tracking changes from 0 to 26 lunar months.*
FDA Label Image

Image (Norethindrone 10)

Image (Norethindrone 10)
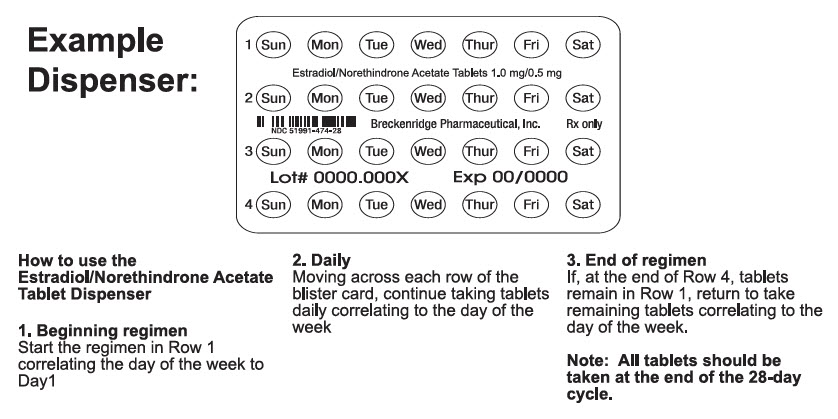
An instructional diagram showing an example blister card dispenser for Estradiol/Norethindrone Acetate tablets 1.0 mg/0.5 mg. It illustrates rows labeled 1 to 4, each with days of the week for tablet intake. Instructions provided guide the user on starting the regimen on Day 1, taking tablets daily by moving across the rows, and how to handle remaining tablets at the end of the regimen.*

* About these descriptions: Image descriptions on this page are generated by automated AI analysis of the product label images from the manufacturer's FDA label submission (SPL). They are provided for reference only and may contain errors or omissions. Always rely on the printed label itself and the official FDA labeling, and consult a pharmacist or healthcare professional with any questions about this product.