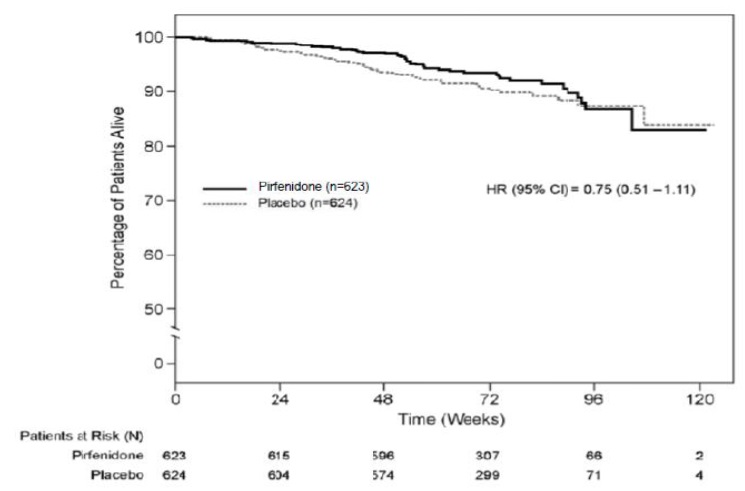
Figure 1 (Pirfenidone 02)

The text appears to be a chart or a table showing the percentage of patients on Pirfenidone and Placebo with worsening or no decline in %FVC (Forced Vital Capacity) after 52 weeks of treatment. It also includes the absolute change in %FVC from baseline. However, the data is not presented clearly and it is difficult to interpret the results without additional information.*