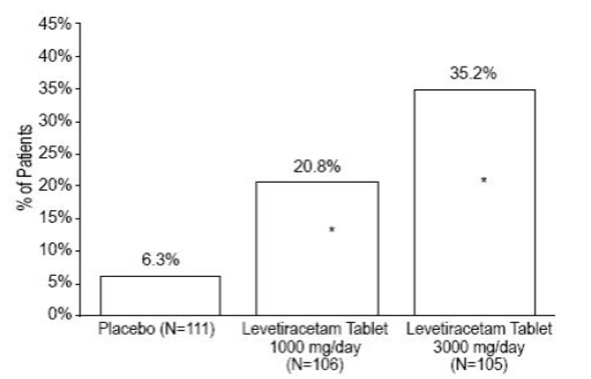
Figure1 (Figure1)
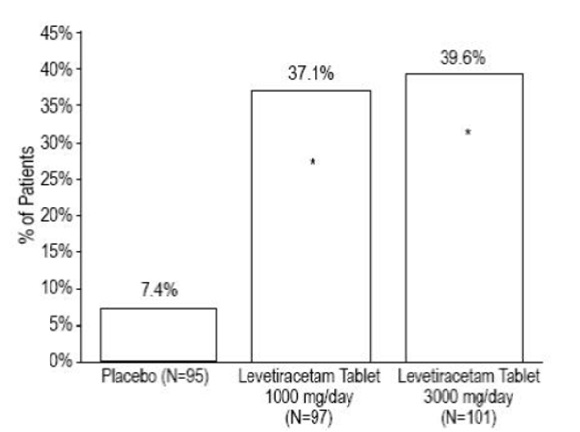
This appears to be a table or chart showing different percentages related to the use of a placebo and two different doses of Levetiracetam Tablet for a group of 85, 97, and 101 individuals. However, without additional context it is not clear what these percentages represent or how they relate to each other.*