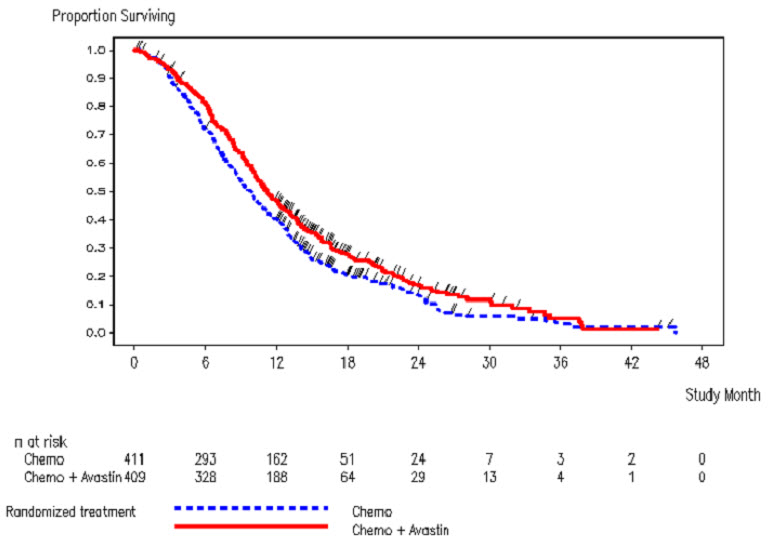
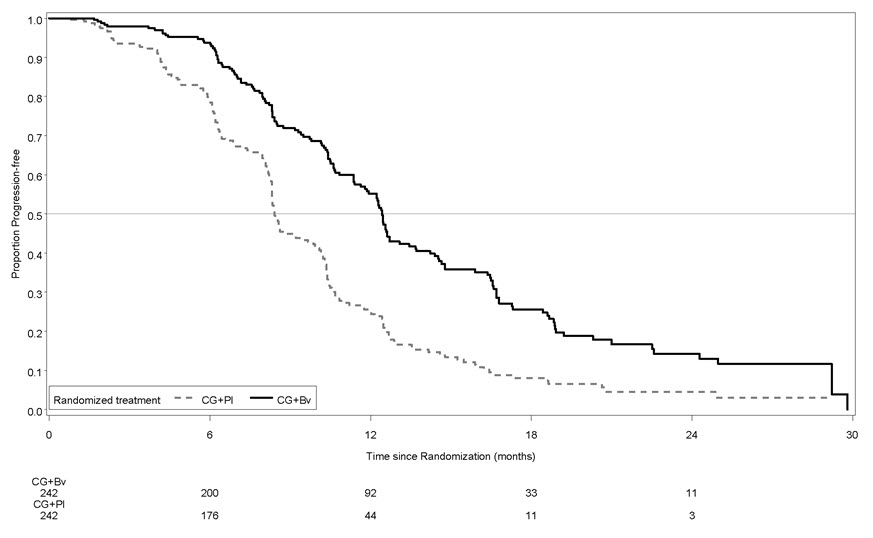
Figure 1 (Avastin 01)

This is a graph showing the duration of survival in months for two groups of patients. The groups are referred to as IFL + Placebo and IFL + Avastin, and the graph shows the number of patients at risk at different time intervals. However, without more context, it is difficult to draw any conclusions.*