Figure 1 (Nutropin 01)
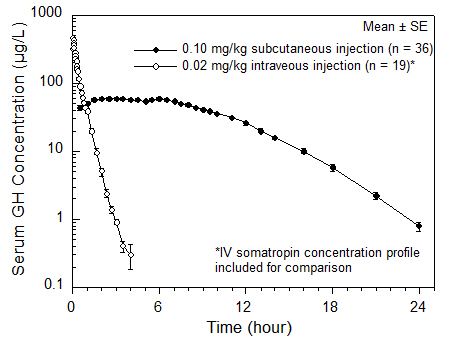
This is a chart depicting Serum GH (growth hormone) concentrations in g/L for two different types of injections - subcutaneous and intravenous - in two different groups of individuals - 36 in the subcutaneous group and 19 in the intravenous group. The mean and standard error are provided for each group. The chart also includes an IV Somatropin concentration profile for comparison. The x-axis shows the time in hours, from 0 to 24, and the y-axis shows the GH concentration in g/L, from 0 to 1000.*