Herceptin Injection, Powder, Lyophilized, For Solution
Product Images NDC 50242-132

8 FDA label images from Genentech, Inc. · Packaging, Regulatory Labels, and Product Appearance

Product Visual Gallery

This gallery contains 8 technical images submitted to the FDA as part of the official labeling for Herceptin (NDC 50242-132). Unlike standard consumer photos, these assets often include clinical data figures, molecular chemical structures, and official manufacturer packaging layouts.

As provided by Genentech, Inc., these visuals offer a comprehensive scientific overview of the product's physical and chemical identity, aiding pharmacists and researchers in product verification and study.

FDA Label Image

Figure 1 (Herceptin 01)
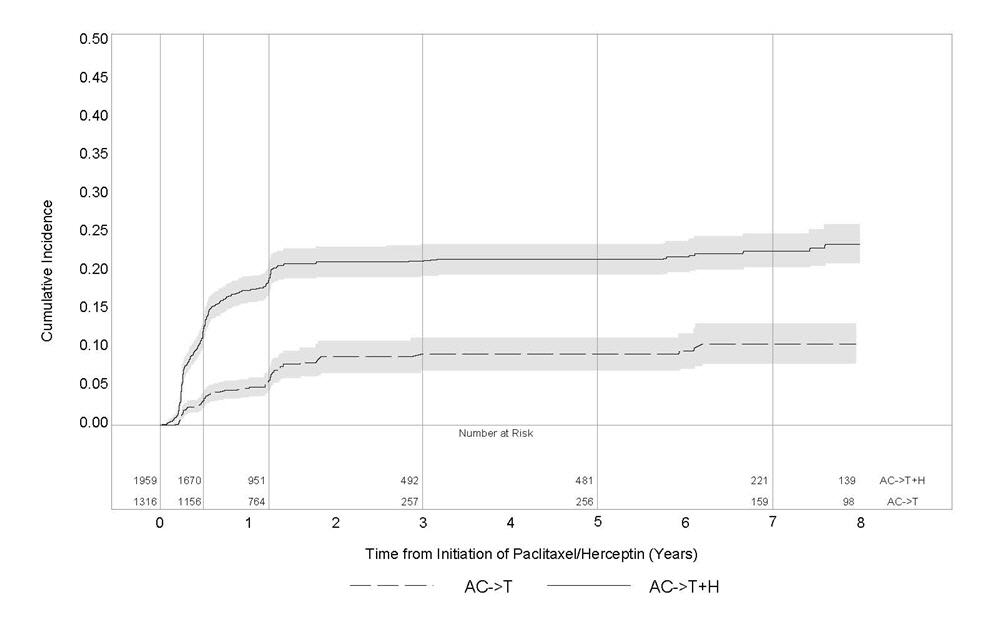
Figure 1 (Herceptin 01)
A cumulative incidence plot showing two treatment sequences over approximately 8 years from initiation of Paclitaxel/Herceptin therapy. The x-axis represents time in years, and the y-axis represents cumulative incidence. Two lines compare AC->T and AC->T+H regimens with shaded confidence intervals. Patient numbers at risk are displayed at various time points below the x-axis.*
FDA Label Image

Figure 2 (Herceptin 02)

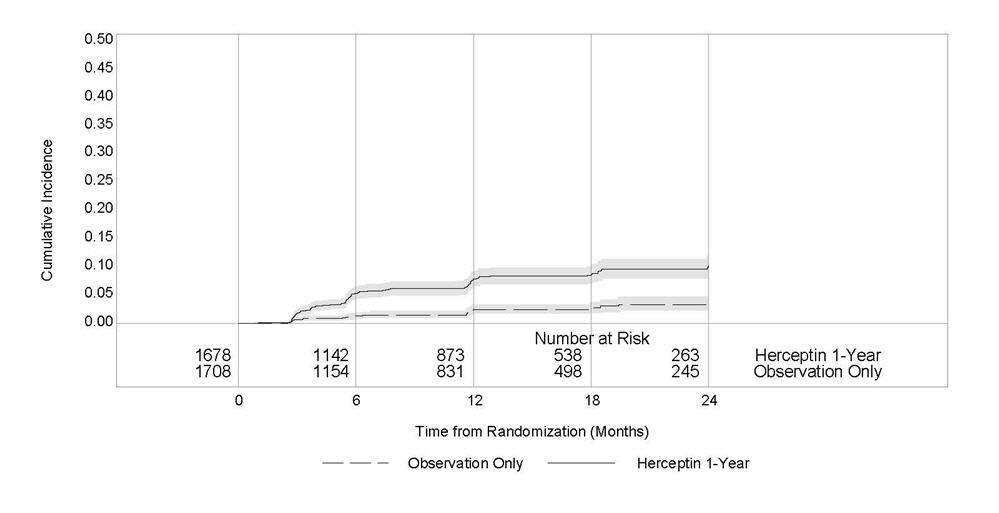
Figure 2 (Herceptin 02)
A Kaplan-Meier cumulative incidence curve comparing Herceptin 1-Year treatment versus Observation Only over 24 months. The x-axis represents time from randomization in months, and the y-axis shows cumulative incidence. The graph includes numbers at risk at various time points for both groups. The Herceptin 1-Year group is represented by a solid line, and the Observation Only group by a dashed line.*
FDA Label Image

Figure 3 (Herceptin 03)

Figure 3 (Herceptin 03)
A line chart depicting cumulative incidence over time (in months) for three cancer treatment regimens involving Herceptin (trastuzumab): AC -> T (doxorubicin and cyclophosphamide followed by docetaxel), AC -> TH (doxorubicin and cyclophosphamide followed by docetaxel plus Herceptin), and TCH (docetaxel plus carboplatin plus Herceptin). The chart includes a legend and a risk table showing the number of participants at various time points.*
FDA Label Image

Figure 4 (Herceptin 04)

Figure 4 (Herceptin 04)
A survival curve graph depicting Disease-Free Survival (years) on the x-axis and Proportion Event-Free on the y-axis. The chart compares two regimens: one including Herceptin (trastuzumab) combined with doxorubicin, cyclophosphamide, and paclitaxel, shown with a dashed line, and another regimen without Herceptin, shown with a solid line. A table below the graph shows the number of patients at risk over time for each regimen.*
FDA Label Image

Figure 5 (Herceptin 05)

Figure 5 (Herceptin 05)
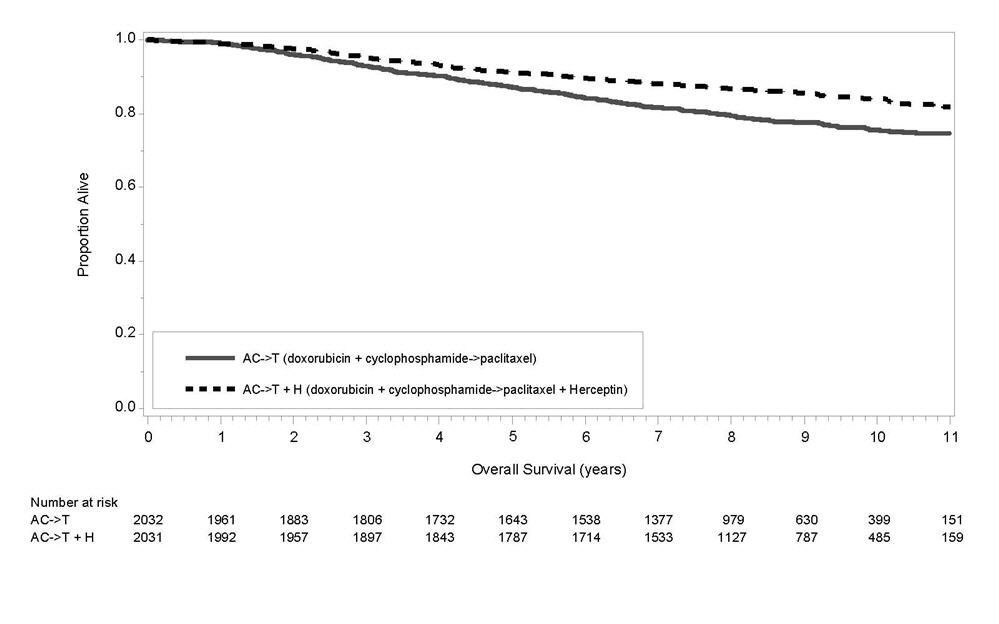
A Kaplan-Meier survival curve comparing overall survival over 11 years between two treatment regimens: AC->T (doxorubicin + cyclophosphamide followed by paclitaxel) and AC->T + H (same regimen plus Herceptin). The graph shows higher survival proportions for the regimen including Herceptin. Below the x-axis is a table indicating the number of patients at risk over time for both groups.*
FDA Label Image

Figure 6 (Herceptin 06)

Figure 6 (Herceptin 06)
A Kaplan-Meier survival curve chart depicting disease-free survival over 5 years for three different chemotherapy regimens involving Herceptin (trastuzumab). The y-axis shows the proportion event-free, and the x-axis represents disease-free survival in years. The chart compares AC->T, AC->TH (docetaxel + Herceptin), and TCH regimens with patient numbers at risk listed below.*
FDA Label Image

Figure 7 (Herceptin 07)

Figure 7 (Herceptin 07)
A Kaplan-Meier survival curve chart showing product-limit survival estimates over duration of survival in months. Two survival curves compare treatments: Fluoropyrimidine + Cisplatin versus Fluoropyrimidine + Cisplatin + Herceptin. The vertical axis shows survival probability from 0 to 1. The horizontal axis displays time up to 50 months. The chart includes the number of subjects at risk at various time points and marks censored data.*
FDA Label Image

Principal Display Panel (440 mg Kit Carton)

Principal Display Panel (440 mg Kit Carton)
Herceptin (trastuzumab) injection, powder, lyophilized, for solution, 150 mg per vial. The label notes it is for intravenous infusion after reconstitution, single-dose vial, no preservative, and unused portion should be discarded. Keep refrigerated. Labeler is Genentech, Inc.*

* About these descriptions: Image descriptions on this page are generated by automated AI analysis of the product label images from the manufacturer's FDA label submission (SPL). They are provided for reference only and may contain errors or omissions. Always rely on the printed label itself and the official FDA labeling, and consult a pharmacist or healthcare professional with any questions about this product.