Cinacalcet Tablet, Film Coated
Product Images NDC 50268-188

View Photos of Packaging, Regulatory Labels, and Product Appearance

Product Visual Gallery

This gallery contains 6 technical images submitted to the FDA as part of the official labeling for Cinacalcet (NDC 50268-188). Unlike standard consumer photos, these assets often include clinical data figures, molecular chemical structures, and official manufacturer packaging layouts.

As provided by Avpak, these visuals offer a comprehensive scientific overview of the product's physical and chemical identity, aiding pharmacists and researchers in product verification and study.

FDA Label Image

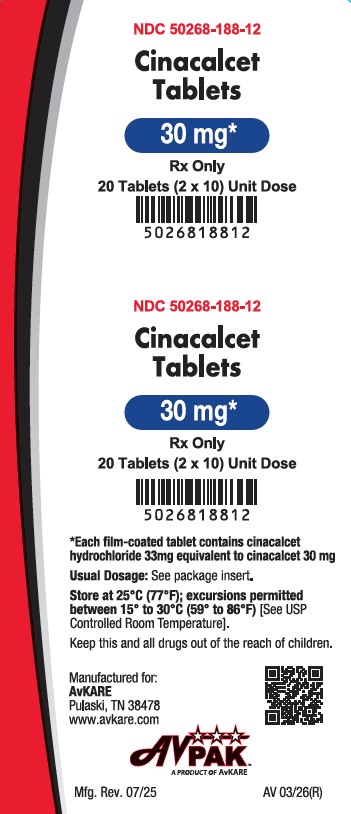
1 (188 12)

1 (188 12)
Packaging label for Cinacalcet tablets 30 mg film-coated oral tablets, labeled Rx Only. The label indicates a quantity of 20 tablets in unit dose packaging (2 x 10). The label includes usage storage instructions and notes it is manufactured for AvKARE in Pulaski, TN. The NDC number displayed is 50268-188-12.*
FDA Label Image

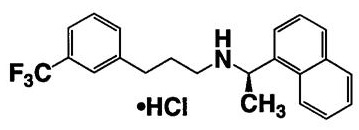
Cinacalcet-structure (40332509 Df24 41a0 A75c 86d556cf0c50 01)

Cinacalcet-structure (40332509 Df24 41a0 A75c 86d556cf0c50 01)
Chemical structure of Cinacalcet hydrochloride depicted as a molecular formula diagram, showing the arrangement of atoms including trifluoromethyl, aromatic rings, and hydrochloride components.*
FDA Label Image

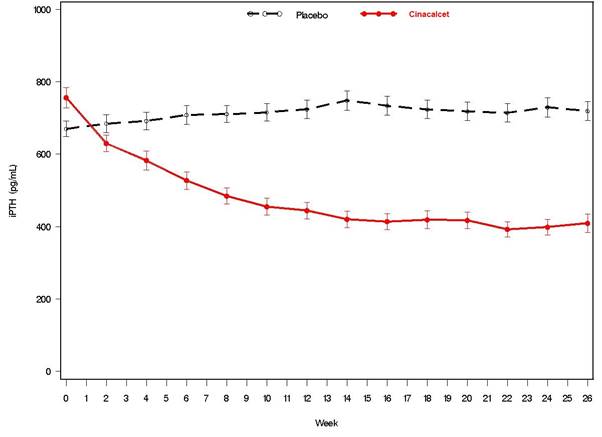
Figure 1 (40332509 Df24 41a0 A75c 86d556cf0c50 02)

Figure 1 (40332509 Df24 41a0 A75c 86d556cf0c50 02)
A line graph comparing iPTH levels (pg/mL) over 26 weeks between Cinacalcet and placebo groups. The x-axis represents weeks from 0 to 26, and the y-axis shows iPTH concentration from 0 to 1000 pg/mL. Cinacalcet data, shown in red, indicates a decline in iPTH levels, while placebo data, in black, shows relatively stable or slightly increasing iPTH levels over time.*
FDA Label Image

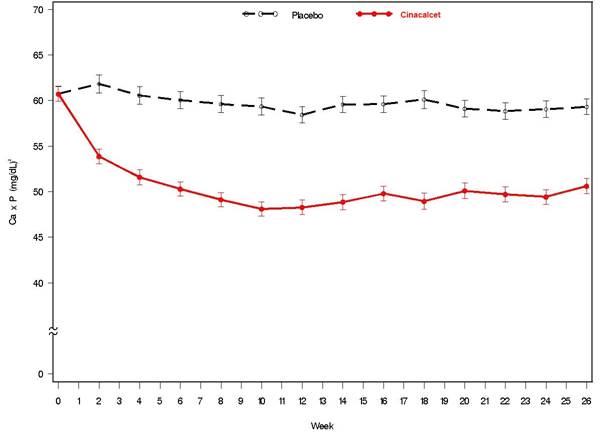
Figure 2 (40332509 Df24 41a0 A75c 86d556cf0c50 03)

Figure 2 (40332509 Df24 41a0 A75c 86d556cf0c50 03)
Line graph comparing the levels of Ca x P (mg/dL) over 26 weeks between Cinacalcet (red line) and placebo (black dashed line). The Cinacalcet group shows a consistent decrease in Ca x P levels over time, while the placebo group's levels remain relatively steady. Error bars indicate variability at each time point.*
FDA Label Image

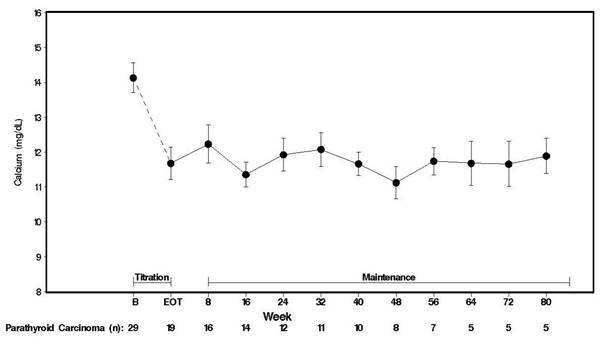
Figure-3 (40332509 Df24 41a0 A75c 86d556cf0c50 04)

Figure-3 (40332509 Df24 41a0 A75c 86d556cf0c50 04)
A line graph depicting serum calcium levels (mg/dL) over time in weeks for patients with parathyroid carcinoma. The x-axis shows weeks from baseline (B) to week 80, with phases labeled Titration, End of Treatment (EOT), and Maintenance. The y-axis ranges from 8 to 16 mg/dL calcium, with data points and error bars illustrating changes in calcium levels across the study duration.*
FDA Label Image

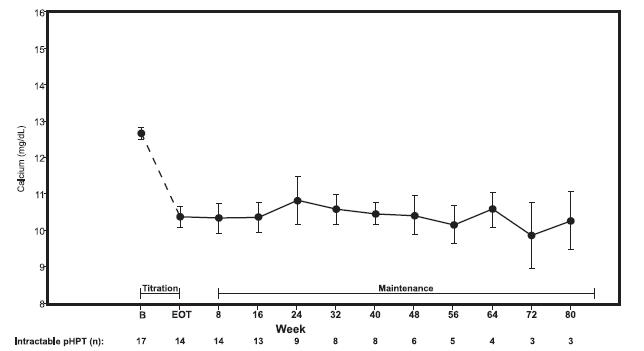
Figure-4 (40332509 Df24 41a0 A75c 86d556cf0c50 05)

Figure-4 (40332509 Df24 41a0 A75c 86d556cf0c50 05)
A line graph depicting serum calcium levels (mg/dL) on the y-axis and time in weeks on the x-axis for patients with intractable pHPT. The graph shows calcium levels over a titration phase followed by a maintenance phase, with error bars indicating variability and decreasing patient numbers over time.*

* About these descriptions: Image descriptions on this page are generated by automated AI analysis of the product label images from the manufacturer's FDA label submission (SPL). They are provided for reference only and may contain errors or omissions. Always rely on the printed label itself and the official FDA labeling, and consult a pharmacist or healthcare professional with any questions about this product.