Dabigatran Capsule
Product Images NDC 50268-200

View Photos of Packaging, Regulatory Labels, and Product Appearance

Product Visual Gallery

This gallery contains 9 technical images submitted to the FDA as part of the official labeling for Dabigatran (NDC 50268-200). Unlike standard consumer photos, these assets often include clinical data figures, molecular chemical structures, and official manufacturer packaging layouts.

As provided by Avpak, these visuals offer a comprehensive scientific overview of the product's physical and chemical identity, aiding pharmacists and researchers in product verification and study.

FDA Label Image

1 (200 11)

1 (200 11)
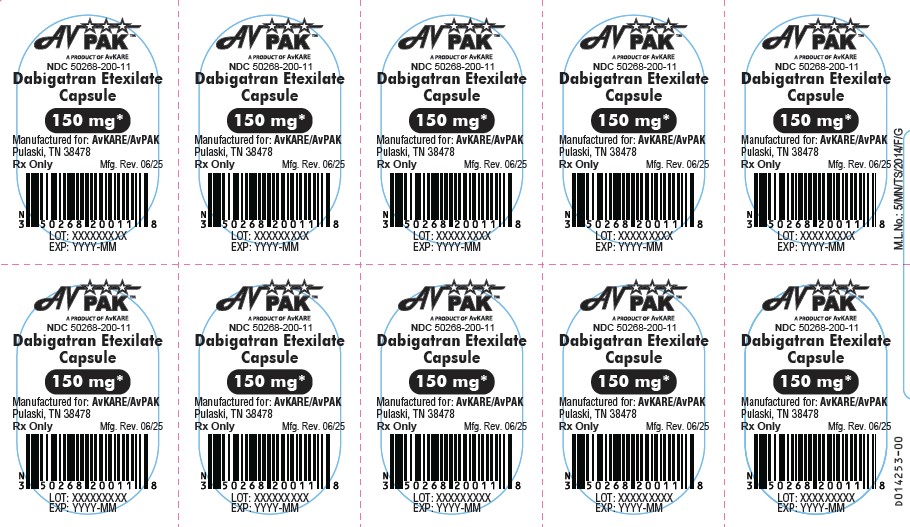
Label image for Dabigatran Etexilate Capsule 150 mg by AvPAK. The label shows the product name, strength (150 mg), dosage form (capsule), and manufacturer information (AvKARE/AvPAK, Pulaski, TN). It includes the NDC 50268-200-11, barcode, and placeholders for lot number and expiration date, with 'Rx Only' and manufacturing revision date 06/25.*
FDA Label Image

1 (200 15)

1 (200 15)
The packaging label for Dabigatran Etexilate Capsules 150 mg by AvPAK features a white background with blue and black text. The front panel displays the product name, strength, and dosage form, along with instructions for pharmacists and usage guidance. The label includes storage instructions, manufacturer details, and a barcode. The package contains 60 capsules (6 bottles of 10 capsules each) and indicates the product is Rx only.*
FDA Label Image

Dabigatran-etexilate-figure-1 (Dabigatran Etexilate Figure 1)

Dabigatran-etexilate-figure-1 (Dabigatran Etexilate Figure 1)
A forest plot chart comparing the hazard ratio and 95% confidence interval of major bleeding events for Dabigatran 150 mg versus Warfarin across various patient subgroups, including age, sex, weight, history of stroke or TIA, diabetes status, CHADS2 score, creatinine clearance, geographic region, and baseline anticoagulant use. The chart illustrates the relative risk with markers positioned along a horizontal axis where values below 1 indicate a benefit for Dabigatran and values above 1 favor Warfarin.*
FDA Label Image

Dabigatran-etexilate-figure-2 (Dabigatran Etexilate Figure 2)

Dabigatran-etexilate-figure-2 (Dabigatran Etexilate Figure 2)
A line chart titled 'aPTT Time Course' depicting activated partial thromboplastin time (aPTT) in seconds over 96 hours. The graph shows different curves representing dabigatran doses based on creatinine clearance (CrCl) ranges, with higher dosing for CrCl > 30 mL/min and lower dosing for CrCl ≤ 30 mL/min. The aPTT decreases over time across all clearance groups from an initial peak toward a baseline around 40 seconds.*
FDA Label Image

Dabigatran-etexilate-figure-3-1 (Dabigatran Etexilate Figure 3 1)

Dabigatran-etexilate-figure-3-1 (Dabigatran Etexilate Figure 3 1)
A scientific plot showing the fold change and 90% confidence intervals of pharmacokinetic parameters AUC and Cmax for various interacting drugs as P-gp inhibitors and inducers. The x-axis represents change relative to reference on a logarithmic scale from 0.25 to 4.0. Data points with error bars illustrate changes for drugs such as Dronedarone, Ketoconazole, Amiodarone, Clarithromycin, Quinidine, Ticagrelor, Verapamil, and Rifampicin under different dosing schedules.*
FDA Label Image

Dabigatran-etexilate-figure-3-2 (Dabigatran Etexilate Figure 3 2)

Dabigatran-etexilate-figure-3-2 (Dabigatran Etexilate Figure 3 2)
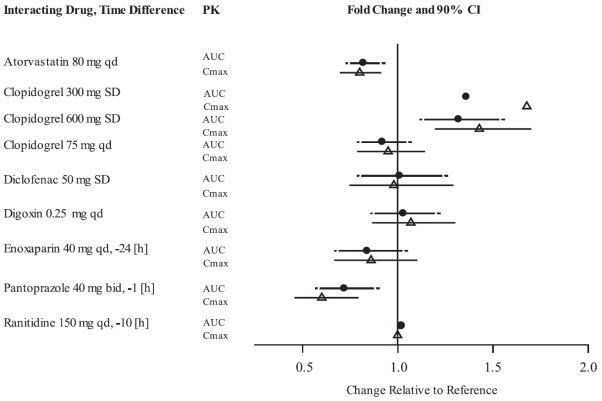
A pharmacokinetic (PK) chart showing the fold change and 90% confidence intervals in Area Under the Curve (AUC) and maximum concentration (Cmax) for various interacting drugs relative to a reference, including Atorvastatin, Clopidogrel (multiple doses), Diclofenac, Digoxin, Enoxaparin, Pantoprazole, and Ranitidine. The x-axis represents change relative to reference from 0.5 to 2.0, visually indicating increases or decreases in PK parameters for these drugs.*
FDA Label Image

Dabigatran-etexilate-figure-4 (Dabigatran Etexilate Figure 4)

Dabigatran-etexilate-figure-4 (Dabigatran Etexilate Figure 4)
A line graph showing estimated cumulative probability over time from randomization (in months) comparing DE 110 mg bid, DE 150 mg bid, and Warfarin groups. Additional data below the graph indicate subjects at risk at various time points for each treatment group.*
FDA Label Image

Dabigatran-etexilate-figure-5 (Dabigatran Etexilate Figure 5)

Dabigatran-etexilate-figure-5 (Dabigatran Etexilate Figure 5)
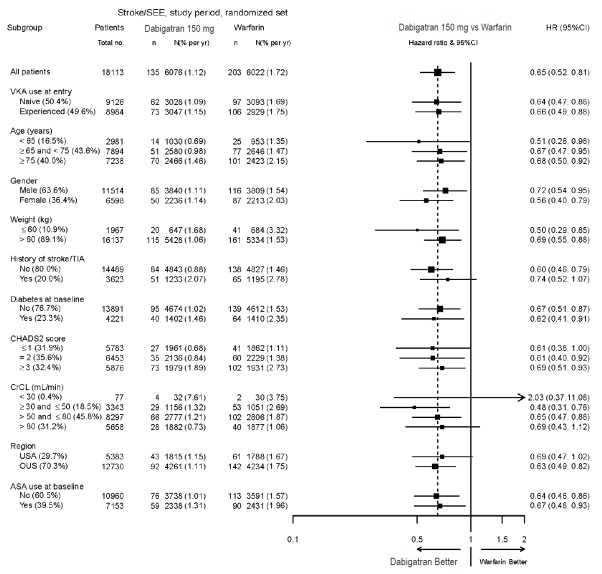
A forest plot comparing the hazard ratios of Dabigatran 150 mg versus Warfarin across various patient subgroups in a stroke and systemic embolic event (SEE) study set. The plot includes subgroups by VKA use at entry, age, gender, weight, stroke/TIA history, diabetes status, CHA2DS2 score, creatinine clearance, region, and baseline atrial septal aneurysm (ASA). Horizontal lines display 95% confidence intervals for hazard ratios, with a vertical line at 1.0 indicating no difference. Dabigatran generally shows hazard ratios less than 1, favoring Dabigatran over Warfarin in most subgroups.*
FDA Label Image

Dabigatran-etexilate-structure (Dabigatran Etexilate Structure)

Dabigatran-etexilate-structure (Dabigatran Etexilate Structure)
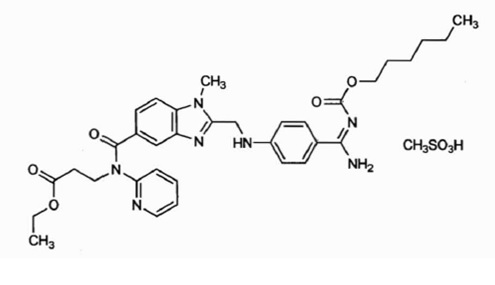
Chemical structure of Dabigatran etexilate depicted in black-and-white line diagram, showing atomic composition and arrangement of the molecule including rings, chains, and functional groups.*

* About these descriptions: Image descriptions on this page are generated by automated AI analysis of the product label images from the manufacturer's FDA label submission (SPL). They are provided for reference only and may contain errors or omissions. Always rely on the printed label itself and the official FDA labeling, and consult a pharmacist or healthcare professional with any questions about this product.