Letrozole Tablet
Product Images NDC 50268-476

7 FDA label images from Avpak · Packaging, Regulatory Labels, and Product Appearance

Product Visual Gallery

This gallery contains 7 technical images submitted to the FDA as part of the official labeling for Letrozole (NDC 50268-476). Unlike standard consumer photos, these assets often include clinical data figures, molecular chemical structures, and official manufacturer packaging layouts.

As provided by Avpak, these visuals offer a comprehensive scientific overview of the product's physical and chemical identity, aiding pharmacists and researchers in product verification and study.

FDA Label Image

476 (476 15)

476 (476 15)
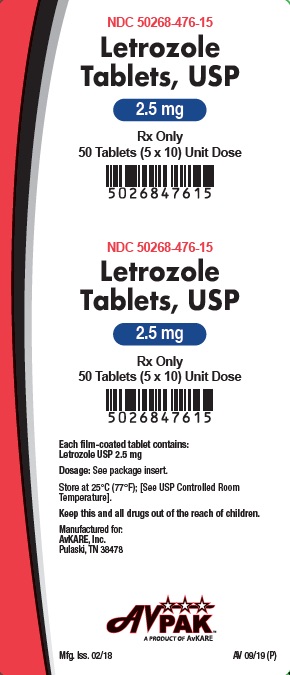
Label for Letrozole Tablets USP 2.5 mg oral tablets by AvPAK, featuring two identical panels each stating 50 tablets (5 bottles of 10 unit dose). Includes NDC 50268-476-15, barcode, storage instructions at 25°C, and manufacturer AvKARE, Inc. located in Pulaski, TN.*
FDA Label Image

Chemical Structure (Letrozole 01)

Chemical Structure (Letrozole 01)
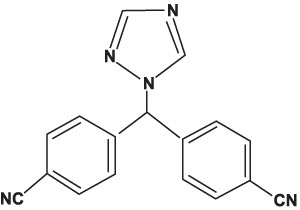
Chemical structure of letrozole showing its molecular framework with two benzene rings, each bearing a cyano group, connected by a nitrogen-containing triazole ring.*
FDA Label Image

Figure 1 (Letrozole 02)

Figure 1 (Letrozole 02)
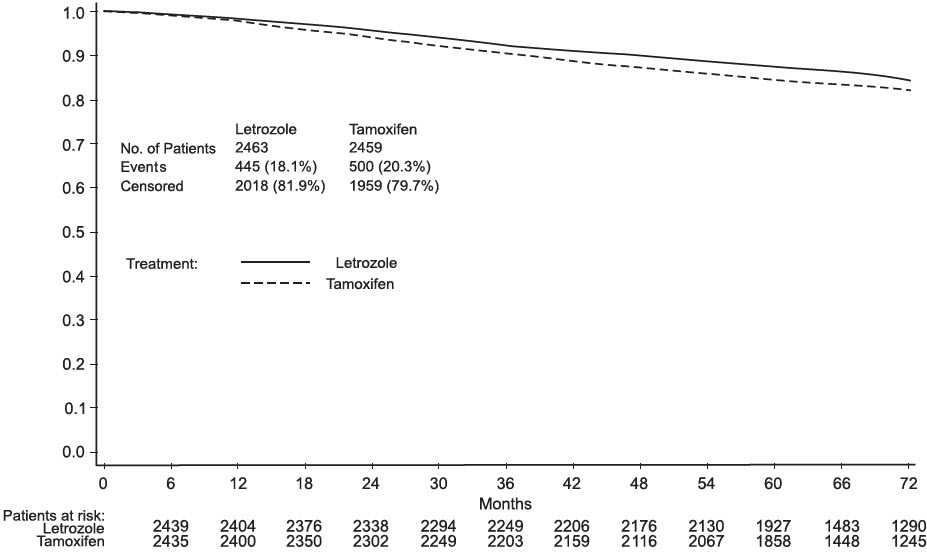
A survival curve chart comparing Letrozole and Tamoxifen treatments over 72 months. The y-axis shows survival probability from 0 to 1.0, and the x-axis shows time in months. Letrozole is depicted with a solid line, Tamoxifen with a dashed line. Numbers of patients, events, and censored data for each treatment are included, along with patients at risk at various time points.*
FDA Label Image

Figure 2 (Letrozole 03)

Figure 2 (Letrozole 03)
Survival curve chart comparing progression-free status over time in months between Letrozole tablets 2.5 mg and tamoxifen 20 mg. The vertical axis shows progression-free proportion from 0 to 1, and the horizontal axis shows time in months up to 60. Two lines represent the progression-free rates, with letrozole shown as a solid line and tamoxifen as a dashed line.*
FDA Label Image

Figure 3 (Letrozole 04)

Figure 3 (Letrozole 04)
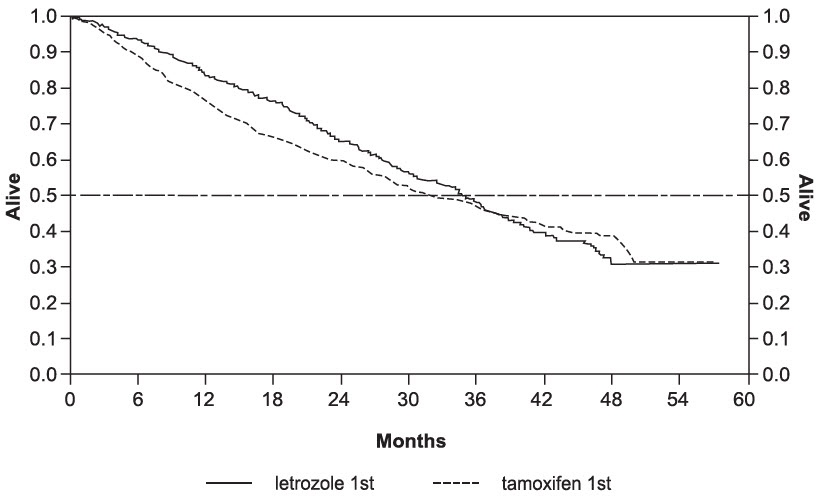
A Kaplan-Meier survival curve comparing overall survival over 60 months between two treatments: letrozole first and tamoxifen first. The y-axis represents the proportion alive from 0 to 1.0, and the x-axis represents time in months from 0 to 60. The solid line shows survival for letrozole first, and the dashed line for tamoxifen first, with both lines starting at 1.0 and decreasing over time.*
FDA Label Image

Figure 4 (Letrozole 05)

Figure 4 (Letrozole 05)
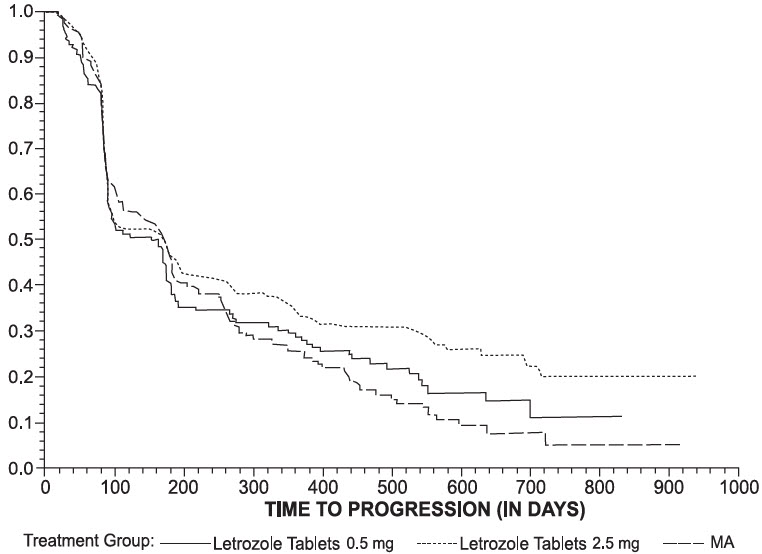
A Kaplan-Meier survival curve chart showing time to progression in days for different treatment groups of Letrozole Tablets at 0.5 mg and 2.5 mg doses, alongside a comparator group labeled MA. The chart illustrates the probability of progression over time for each group with distinct line styles.*
FDA Label Image

Figure 5 (Letrozole 06)

Figure 5 (Letrozole 06)
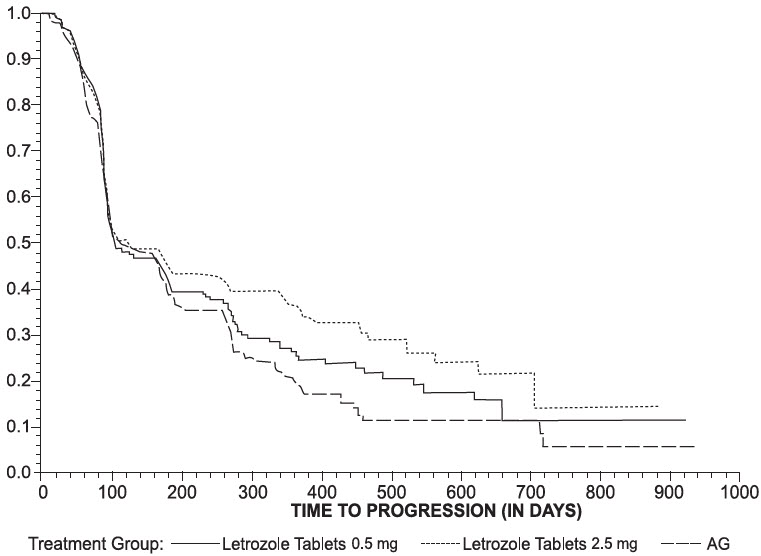
A Kaplan-Meier survival curve graph showing time to progression in days on the x-axis versus survival probability on the y-axis. The graph compares three treatment groups: Letrozole Tablets 0.5 mg, Letrozole Tablets 2.5 mg, and AG, with differing line styles representing each group.*

* About these descriptions: Image descriptions on this page are generated by automated AI analysis of the product label images from the manufacturer's FDA label submission (SPL). They are provided for reference only and may contain errors or omissions. Always rely on the printed label itself and the official FDA labeling, and consult a pharmacist or healthcare professional with any questions about this product.