Sacubitril And Valsartan Tablet, Film Coated
Product Images NDC 50268-606

View Photos of Packaging, Regulatory Labels, and Product Appearance

Product Visual Gallery

This gallery contains 9 technical images submitted to the FDA as part of the official labeling for Sacubitril And Valsartan (NDC 50268-606). Unlike standard consumer photos, these assets often include clinical data figures, molecular chemical structures, and official manufacturer packaging layouts.

As provided by Avpak, these visuals offer a comprehensive scientific overview of the product's physical and chemical identity, aiding pharmacists and researchers in product verification and study.

FDA Label Image

1 (606 15)

1 (606 15)
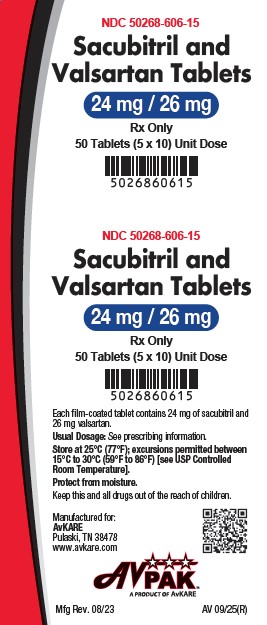
The image shows the packaging label for Sacubitril and Valsartan Tablets, film-coated oral tablets with a strength of 24 mg/26 mg. The label states Rx Only and a bottle containing 50 tablets (5 x 10 unit dose). It includes storage instructions, a barcode, manufacturer information for AvPAK in Pulaski, TN, and two QR codes. The label highlights the proprietary name and dosage prominently.*
FDA Label Image

1 (607 15)

1 (607 15)
Sacubitril and Valsartan Tablets 49 mg / 51 mg film-coated oral tablets in a package containing 50 tablets (5 x 10 unit doses). The label includes storage instructions, manufacturer AvPAK information, and barcodes. The label shows the NDC 50268-607-15 and states Rx Only.*
FDA Label Image

1 (608 13)

1 (608 13)
Sacubitril and Valsartan Tablets 97 mg / 103 mg film-coated tablets label for prescription use. The package contains 30 tablets in unit dose blister packs (6 x 5). The label displays the NDC 50268-608-13, storage instructions, manufacturer details (AvPAK, Pulaski, TN), and a QR code.*
FDA Label Image

1 (How Supplied)

1 (How Supplied)
Table listing Sacubitril and Valsartan film-coated tablets by strength, color, and debossment. Strengths include 24 mg/26 mg (purple, debossed with 'M' and S1), 49 mg/51 mg (light yellow, debossed with 'M' and S2), and 97 mg/103 mg (light pink, debossed with 'M' and S3). Packaging details and NDC codes are also provided.*
FDA Label Image

Figure-1 (Sacubitril Valsartan Figure 1)

Figure-1 (Sacubitril Valsartan Figure 1)
A forest plot showing the geometric mean ratio and 90% confidence intervals for changes in AUC and Cmax of various coadministered drugs relative to reference. Drugs listed include Furosemide, Warfarin, Digoxin, Carvedilol, Levonorgestrel, Ethinyl estradiol, Amlodipine, HCTZ, Metformin, Atorvastatin, and Sildenafil. Data points for AUC are filled circles and for Cmax are open circles, with x-axis labeled 'Change relative to reference' ranging approximately from 0.5 to 2.*
FDA Label Image

Figure-2 (Sacubitril Valsartan Figure 2)

Figure-2 (Sacubitril Valsartan Figure 2)
A chart showing the geometric mean ratio and 90% confidence interval comparing LBO657 and Valsartan in various population subgroups. The left panel shows changes in AUC (area under the curve) and the right panel shows changes in Cmax (maximum concentration) relative to reference values, with subgroups including different degrees of renal and hepatic impairment, age, sex, and race.*
FDA Label Image

Sacubitril-valsartan-figure-3.jpg (Sacubitril Valsartan Figure 3)

Sacubitril-valsartan-figure-3.jpg (Sacubitril Valsartan Figure 3)
Three Kaplan-Meier curves comparing Sacubitril and Valsartan versus Enalapril in PARADIGM-HF trials. Figure A shows time to first occurrence of cardiovascular death or heart failure hospitalizations; Figure B shows time to cardiovascular death; Figure C shows time to heart failure hospitalizations. Each graph includes risk table data and hazard ratios with confidence intervals.*
FDA Label Image

Structure (Sacubitril Valsartan Structure)

Structure (Sacubitril Valsartan Structure)
Chemical structure diagram of the active ingredients Sacubitril and Valsartan shown as molecular formulas with labeled atoms and bonds.*
FDA Label Image

Sacubitril-valsartanl-figure-4.jpg (Sacubitril Valsartanl Figure 4)

Sacubitril-valsartanl-figure-4.jpg (Sacubitril Valsartanl Figure 4)
A forest plot comparing hazard ratios between Sacubitril and Valsartan versus Enalapril across various subgroups, including age, gender, weight, race, region, NYHA class, kidney function, diabetes status, blood pressure, ejection fraction, atrial fibrillation, NT-proBNP levels, hypertension, prior use of ACE inhibitors, ARBs, aldosterone antagonists, hospitalization history, time since heart failure diagnosis, cause of heart failure, and ICD usage. The plot displays confidence intervals and subgroup percentages of the total population.*

* About these descriptions: Image descriptions on this page are generated by automated AI analysis of the product label images from the manufacturer's FDA label submission (SPL). They are provided for reference only and may contain errors or omissions. Always rely on the printed label itself and the official FDA labeling, and consult a pharmacist or healthcare professional with any questions about this product.