Tizanidine Tablet
Product Images NDC 50268-759

View Photos of Packaging, Regulatory Labels, and Product Appearance

Product Visual Gallery

This gallery contains 6 technical images submitted to the FDA as part of the official labeling for Tizanidine (NDC 50268-759). Unlike standard consumer photos, these assets often include clinical data figures, molecular chemical structures, and official manufacturer packaging layouts.

As provided by Avpak, these visuals offer a comprehensive scientific overview of the product's physical and chemical identity, aiding pharmacists and researchers in product verification and study.

FDA Label Image

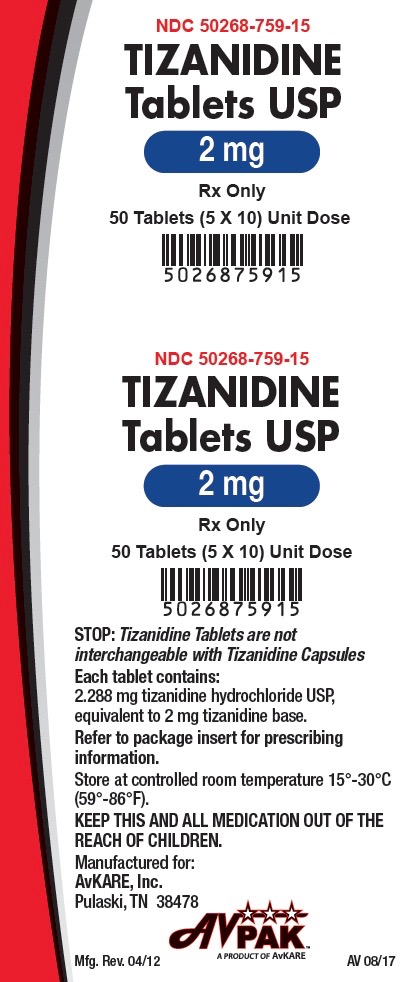
2 (2mg)

2 (2mg)
Tizanidine Tablets USP 2 mg oral tablets packaging label showing quantity of 50 tablets (5 x 10 unit dose). The label includes the NDC 50268-759-15, Rx only designation, barcode, and storage instructions to keep at controlled room temperature. Manufacturer is AvKARE, Inc., Pulaski, TN, under the AvPAK brand.*
FDA Label Image

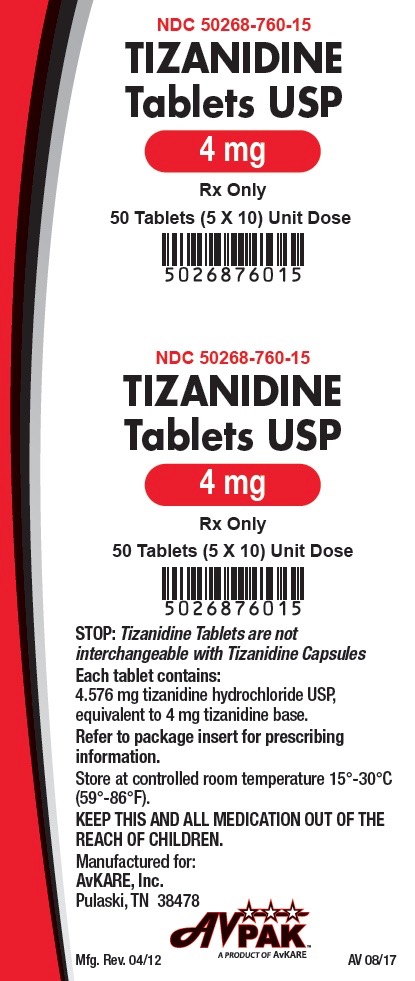
4 (4mg.)

4 (4mg.)
Tizanidine Tablets USP 4 mg oral tablets, bottle label showing two identical product sections. Each section states NDC 50268-760-15, 50 tablets (5 X 10) unit dose, Rx only. Contains manufacturer information AvKARE, Inc., Pulaski, TN, storage instructions, and a barcode.*
FDA Label Image

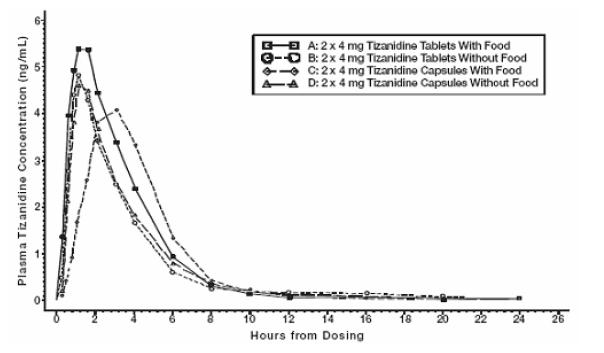
Fig1 (Fig1)

Fig1 (Fig1)
A pharmacokinetic graph showing plasma Tizanidine concentration (ng/mL) over time in hours after dosing. The plot compares concentrations following administration of 2 x 4 mg Tizanidine tablets and capsules, both with and without food intake, illustrating differences in absorption and concentration profiles over 24 hours.*
FDA Label Image

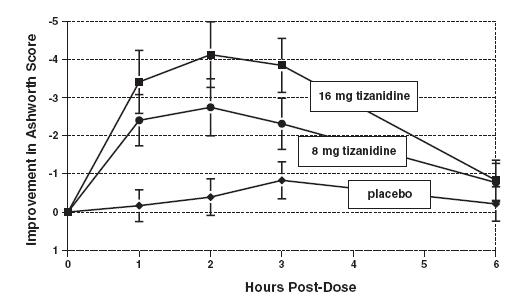
Fig2 (Fig2)

Fig2 (Fig2)
A line graph showing improvement in Ashworth Score over time (hours post-dose) comparing 16 mg tizanidine, 8 mg tizanidine, and placebo. The y-axis represents improvement in Ashworth Score, while the x-axis shows hours post-dose from 0 to 6. Data points for each group include error bars indicating variability.*
FDA Label Image

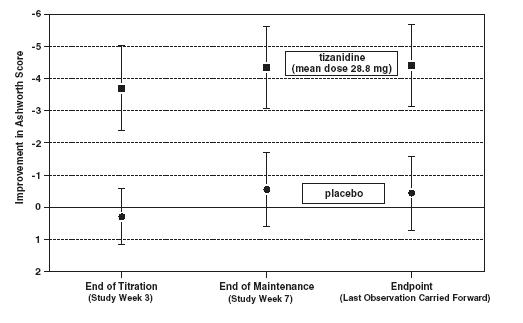
Fig3 (Fig3)

Fig3 (Fig3)
A line plot showing improvement in Ashworth Score over time at three points: End of Titration (Study Week 3), End of Maintenance (Study Week 7), and Endpoint (Last Observation Carried Forward). The graph compares two groups, tizanidine (mean dose 28.8 mg) and placebo, with tizanidine showing a greater reduction in scores at all points. Error bars indicate variability around the mean improvements.*
FDA Label Image

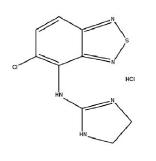
Structure (Structure)

Structure (Structure)
Chemical structure diagram of Tizanidine hydrochloride, showing the molecular arrangement including fused rings and attached functional groups, consistent with its molecular composition.*

* About these descriptions: Image descriptions on this page are generated by automated AI analysis of the product label images from the manufacturer's FDA label submission (SPL). They are provided for reference only and may contain errors or omissions. Always rely on the printed label itself and the official FDA labeling, and consult a pharmacist or healthcare professional with any questions about this product.