Beyaz Kit
Product Images NDC 50419-407

14 FDA label images from Bayer Healthcare Pharmaceuticals Inc. · Packaging, Regulatory Labels, and Product Appearance

Product Visual Gallery

This gallery contains 14 technical images submitted to the FDA as part of the official labeling for Beyaz (NDC 50419-407). Unlike standard consumer photos, these assets often include clinical data figures, molecular chemical structures, and official manufacturer packaging layouts.

As provided by Bayer Healthcare Pharmaceuticals Inc., these visuals offer a comprehensive scientific overview of the product's physical and chemical identity, aiding pharmacists and researchers in product verification and study.

FDA Label Image

50419 0407 01 Splimage30 42192129

50419 0407 01 Splimage30 42192129
Beyaz tablet, shown front and back, is round and reddish-brown. The front side is embossed with a hexagon containing the imprint 'Z+'. The back side is plain. There is a millimeter scale in the image background for size reference. This image corresponds to Beyaz kit by Bayer HealthCare Pharmaceuticals Inc.*
FDA Label Image

50419 0407 01 Splimage30 44192279

50419 0407 01 Splimage30 44192279
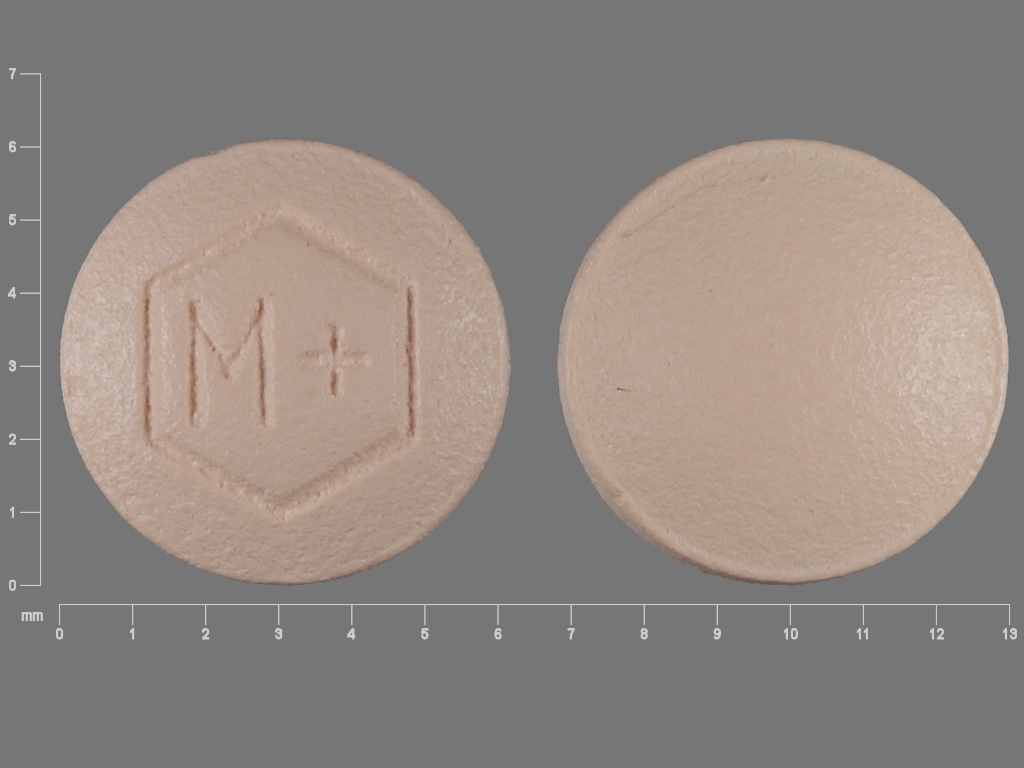
Image of a round, beige tablet associated with Beyaz, a kit containing Drospirenone/ethinyl estradiol/levomefolate calcium and levomefolate calcium by Bayer HealthCare Pharmaceuticals Inc. One side of the tablet is embossed with a hexagonal border containing the imprint 'M+'. The other side is plain. The tablet size is shown with a millimeter scale.*
FDA Label Image

Chemical Structure (99e6c01a 25df 4779 8ad9 8fd73810e6dd 03)

Chemical Structure (99e6c01a 25df 4779 8ad9 8fd73810e6dd 03)
Chemical structure diagrams of the active ingredients Drospirenone, Ethinyl estradiol, and Levomefolate Calcium in the Beyaz human prescription drug kit by Bayer HealthCare Pharmaceuticals. Each structure is labeled with the corresponding chemical name.*
FDA Label Image

Figure 3 (99e6c01a 25df 4779 8ad9 8fd73810e6dd 04)

Figure 3 (99e6c01a 25df 4779 8ad9 8fd73810e6dd 04)
A line graph comparing two groups, YAZ plus levomefolate calcium and YAZ alone, over a 24-week period. The y-axis represents a measured variable ranging from 0 to 100, while the x-axis shows time in weeks, starting from pre-treatment to 24 weeks. Data points are marked with squares for the YAZ plus levomefolate calcium group and circles for the YAZ group, with vertical error bars indicating variability at each time point.*
FDA Label Image

Figure 4 (99e6c01a 25df 4779 8ad9 8fd73810e6dd 05)

Figure 4 (99e6c01a 25df 4779 8ad9 8fd73810e6dd 05)
A line graph comparing two treatment groups over 24 weeks: "YAZ + levomefolate calcium (N=122)" marked with open squares, and "YAZ (N=44)" marked with filled circles. The y-axis shows a measured value ranging from 400 to 2000, with error bars indicating variability at each time point. The x-axis shows time in weeks from pre-treatment to 24 weeks.*
FDA Label Image

Figure 5 (99e6c01a 25df 4779 8ad9 8fd73810e6dd 06)

Figure 5 (99e6c01a 25df 4779 8ad9 8fd73810e6dd 06)
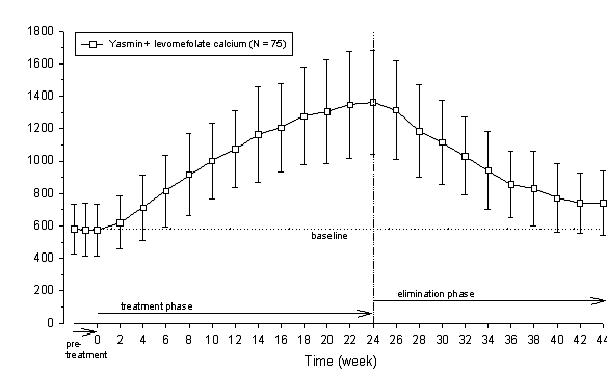
A line chart showing time-course data for 'Yasmin + levomefolate calcium' over a 44-week period. The x-axis represents time in weeks, including pretreatment, treatment, and elimination phases. The y-axis appears to show a quantitative measure ranging roughly from 0 to 80. Data points with error bars are plotted to indicate variability across 75 samples.*
FDA Label Image

Figure 6 (99e6c01a 25df 4779 8ad9 8fd73810e6dd 07)

Figure 6 (99e6c01a 25df 4779 8ad9 8fd73810e6dd 07)
A line graph showing change over time in a variable for subjects taking Yasmin plus levomefolate calcium (N=75). The x-axis represents time in weeks from pre-treatment through 44 weeks, divided into treatment and elimination phases. The y-axis shows the measured variable values, with error bars at each time point indicating variability.*
FDA Label Image

Chart (99e6c01a 25df 4779 8ad9 8fd73810e6dd 08)

Chart (99e6c01a 25df 4779 8ad9 8fd73810e6dd 08)
An illustration showing a vertical arrow labeled 'Fewer Pregnancies' at the top and 'More Pregnancies' at the bottom, indicating pregnancy rates per 100 women in one year. It categorizes birth control methods by effectiveness: top box lists implants, injections, intrauterine devices, sterilization; next box lists birth control pills, skin patch, vaginal ring with hormones; third box lists condoms and diaphragm; fourth box lists no sex during fertile days, spermicide, withdrawal; bottom box lists no birth control corresponding to highest pregnancy rates.*
FDA Label Image

Foil (99e6c01a 25df 4779 8ad9 8fd73810e6dd 09)

Foil (99e6c01a 25df 4779 8ad9 8fd73810e6dd 09)
Beyaz tablet kit illustrated as a blister pack with 28 round tablets. The pack includes the active ingredients drospirenone, ethinyl estradiol, levomefolate calcium in combination tablets, and levomefolate calcium tablets. Arrows guide usage from the start position through the kit. "Place Day Label Here" area is visible at the top. The product is labeled by Bayer HealthCare Pharmaceuticals Inc.*
FDA Label Image

Blood Clot Risk (99e6c01a 25df 4779 8ad9 8fd73810e6dd 10)

Blood Clot Risk (99e6c01a 25df 4779 8ad9 8fd73810e6dd 10)
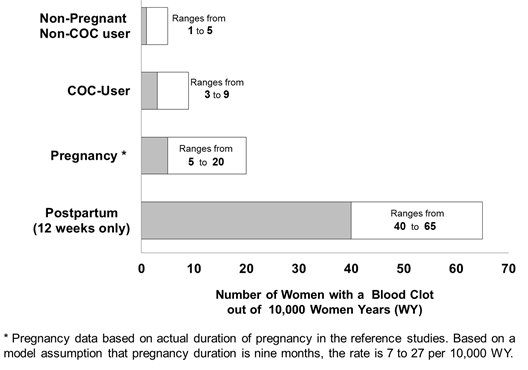
A bar chart comparing the number of women with a blood clot per 10,000 women-years across four categories: Non-Pregnant Non-COC users (range 1 to 5), COC users (range 3 to 9), Pregnancy (range 5 to 20), and Postpartum (12 weeks only) with the highest range from 40 to 65. The chart highlights the variation in blood clot risk among different groups of women.*
FDA Label Image

Beyaz Blister Pack 1 Unit Carton (99e6c01a 25df 4779 8ad9 8fd73810e6dd 11)

Beyaz Blister Pack 1 Unit Carton (99e6c01a 25df 4779 8ad9 8fd73810e6dd 11)
Beyaz kit packaging label displaying the proprietary name 'Beyaz' and the active ingredients drospirenone, ethinyl estradiol, and levomefolate calcium. Strengths stated include 3 mg, 0.02 mg, 0.451 mg, and 0.451 mg for the respective components. The label indicates it contains 28 tablets for oral use. The Bayer HealthCare Pharmaceuticals Inc. logo is present along with the NDC 50419-407 on the packaging.*
FDA Label Image

Figure 1 (Image 01)

Figure 1 (Image 01)
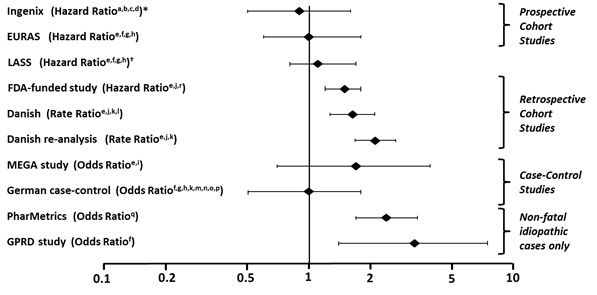
A forest plot displaying hazard ratios, rate ratios, or odds ratios from multiple studies categorized into prospective cohort studies, retrospective cohort studies, case-control studies, and non-fatal idiopathic cases only. The x-axis is logarithmic, ranging from 0.1 to 10, with a reference line at 1, showing the relative risk estimates with confidence intervals for each study listed on the y-axis.*
FDA Label Image

Image 02

Image 02
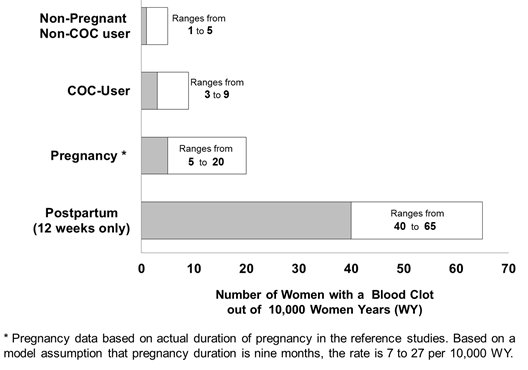
A bar chart comparing the number of women with a blood clot per 10,000 women years across different groups: Non-Pregnant Non-COC users (1 to 5), COC users (3 to 9), Pregnancy (5 to 20), and Postpartum (12 weeks only) ranging from 40 to 65. The chart visually illustrates relative blood clot risks among these categories.*
FDA Label Image

Image 03

Image 03
A forest plot titled 'Relevant Studies of Risk of Breast Cancer with Combined Oral Contraceptives' comparing effect estimates (odds ratio, relative risk, hazard ratio) from several cohort studies for 'Ever COC vs. Never COC Use' and 'Current COC use vs. Never-Use.' The x-axis represents the effect estimate ranging from -1.50 to 2.00, with points and confidence intervals plotted for each study.*

* About these descriptions: Image descriptions on this page are generated by automated AI analysis of the product label images from the manufacturer's FDA label submission (SPL). They are provided for reference only and may contain errors or omissions. Always rely on the printed label itself and the official FDA labeling, and consult a pharmacist or healthcare professional with any questions about this product.