Sildenafil Citrate
Product Images NDC 50436-0005

View Photos of Packaging, Regulatory Labels, and Product Appearance

Product Visual Gallery

This gallery contains 9 technical images submitted to the FDA as part of the official labeling for Sildenafil Citrate (NDC 50436-0005). Unlike standard consumer photos, these assets often include clinical data figures, molecular chemical structures, and official manufacturer packaging layouts.

As provided by Unit Dose Services, these visuals offer a comprehensive scientific overview of the product's physical and chemical identity, aiding pharmacists and researchers in product verification and study.

FDA Label Image

Label Image (Lbl504360005)

Label Image (Lbl504360005)
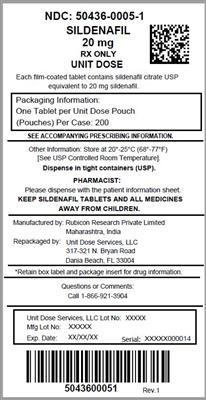
This is a prescription drug with the National Drug Code (NDC) 50436-0005-1. It contains Sildenafil of 20mg strength. Rest of the text is unclear.*
FDA Label Image

Graph (Sildenafil Tablets Usp 20mg Figure 06)

FDA Label Image

Graph (Sildenafil Tablets Usp 20mg Figure 07)

Graph (Sildenafil Tablets Usp 20mg Figure 07)
This text appears to be a chart or table related to drug interactions and dosages. It provides recommendations for nodose adjustment and fold change in interacting drugs and mentions the AUC and Cmax levels for different medicines. There is also a reference to a study on exercise capacity and the combination of certain drugs.*
FDA Label Image

Graph (Sildenafil Tablets Usp 20mg Figure 08)

Graph (Sildenafil Tablets Usp 20mg Figure 08)
This text is a drug interaction chart showing how the drug Acenocoumarol interacts with other drugs such as aspirin, atorvastatin, and phenprocoumon. The chart shows how the fold change and 90% CI Recommendation affect INR AUC, INR Cmax, BT, AUC, and Cmax. The chart recommends no dose adjustment for most of the drugs, whereas co-administration of Saquinavir with Acenocoumarol is not recommended. There's also a footnote indicating that based on the effect of ritonavir on sildenafil PK, no dose adjustment is required.*
FDA Label Image

Graph (Sildenafil Tablets Usp 20mg Figure 09)

Graph (Sildenafil Tablets Usp 20mg Figure 09)
This text seems to be a table showing the change from baseline in meters for four different dosage groups of a medication (placebo, 20mg, 40mg and 80mg). The data is presented for weeks 4, 8, and 12 in a study. Therefore, this text is likely a summary of the results from a clinical trial investigating the effectiveness of sildenafil on a certain condition.*
FDA Label Image

Graph (Sildenafil Tablets Usp 20mg Figure 10)

Graph (Sildenafil Tablets Usp 20mg Figure 10)
This appears to be a medical document discussing the use of placebo and sildenafil for patients with idiopathic pulmonary arterial hypertension. It includes patient data such as age, gender, and baseline walk distance. The document also includes metrics such as mean pulmonary artery pressure and placebo-corrected change in 6-minute walk distance.*
FDA Label Image

Graph (Sildenafil Tablets Usp 20mg Figure 11)

FDA Label Image

Graph (Sildenafil Tablets Usp 20mg Figure 12)

FDA Label Image

Structure Formula (Sildenafil Tablets Usp 20mg Structure)

* These product label images have been analyzed using experimental machine learning. Please verify findings with the primary label text.