Sildenafil
Product Images NDC 50436-0034

View Photos of Packaging, Regulatory Labels, and Product Appearance

Product Visual Gallery

This gallery contains 24 technical images submitted to the FDA as part of the official labeling for Sildenafil (NDC 50436-0034). Unlike standard consumer photos, these assets often include clinical data figures, molecular chemical structures, and official manufacturer packaging layouts.

As provided by Unit Dose Services, these visuals offer a comprehensive scientific overview of the product's physical and chemical identity, aiding pharmacists and researchers in product verification and study.

FDA Label Image

Label Image (Lbl504360034)
Label Image (Lbl504360034)
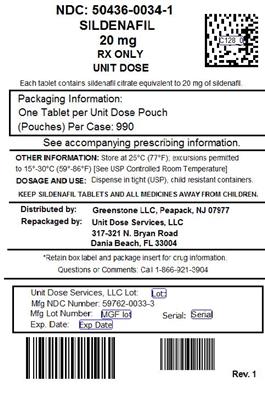
Sildenafil 20 mg unit dose pouch label with NDC 50436-0034-1, distributed by Greenstone LLC and repackaged by Unit Dose Services, LLC. The label specifies that each tablet contains sildenafil citrate equivalent to 20 mg sildenafil. It includes storage instructions, manufacturer and lot details, and a barcode. The product is for prescription use only.*
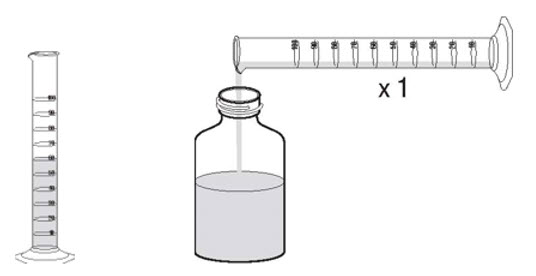
FDA Label Image

Figure 1 (Sildenafil 01)

Figure 1 (Sildenafil 01)
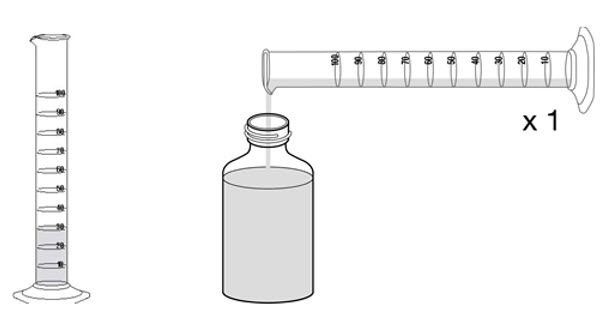
An instructional illustration showing a graduated cylinder next to a bottle filled partially with liquid, with a plunger-like device labeled 'x1' positioned above the bottle. The image likely depicts a measurement and preparation step for a liquid medication.*
FDA Label Image

Figure 2 (Sildenafil 02)

Figure 2 (Sildenafil 02)
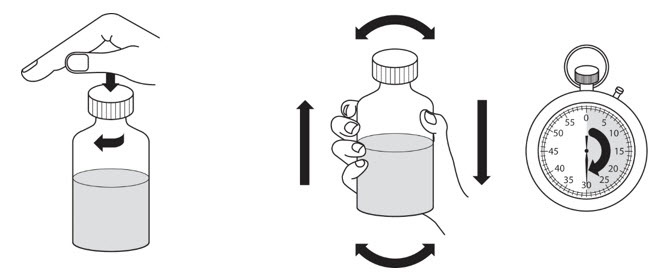
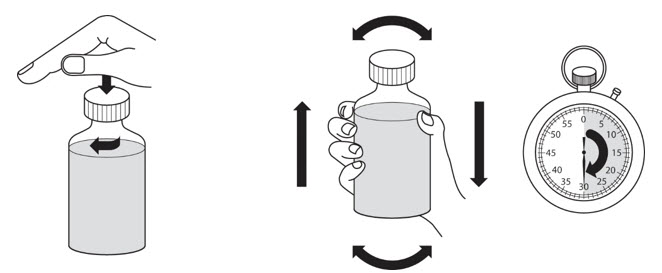
Illustration showing step-by-step instructions for preparing a liquid medication: pressing and turning the bottle cap, shaking the bottle vertically and horizontally, and timing the process with a stopwatch set at 30 seconds.*
FDA Label Image

Figure 3 (Sildenafil 03)

Figure 3 (Sildenafil 03)
An instructional diagram depicting the use of a 10 mL oral syringe for measuring and dispensing liquid medication from a bottle. The syringe is shown with measurement markings and is drawn pouring liquid into an open bottle.*
FDA Label Image

Figure 4 (Sildenafil 04)

Figure 4 (Sildenafil 04)
An instructional illustration showing how to open and shake a bottle. The first image demonstrates pushing down and twisting the cap to open. The second image shows holding the bottle and gently shaking it up and down. The third image depicts a stopwatch indicating a 30-second wait time, likely referencing shaking duration or wait period.*
FDA Label Image

Figure 5 (Sildenafil 05)

Figure 5 (Sildenafil 05)
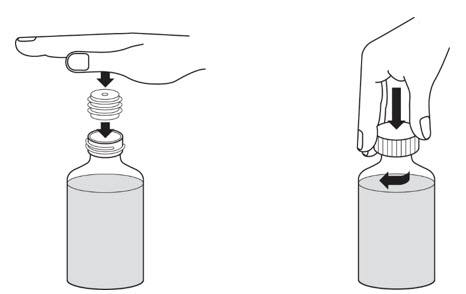
An instructional diagram showing two steps to open a bottle with a child-resistant cap. The first step depicts pushing down on the cap with a finger before turning, and the second step shows twisting the cap counterclockwise to open the bottle. No product-specific text or branding is visible in the image.*
FDA Label Image

Figure 6 (Sildenafil 06)

Figure 6 (Sildenafil 06)
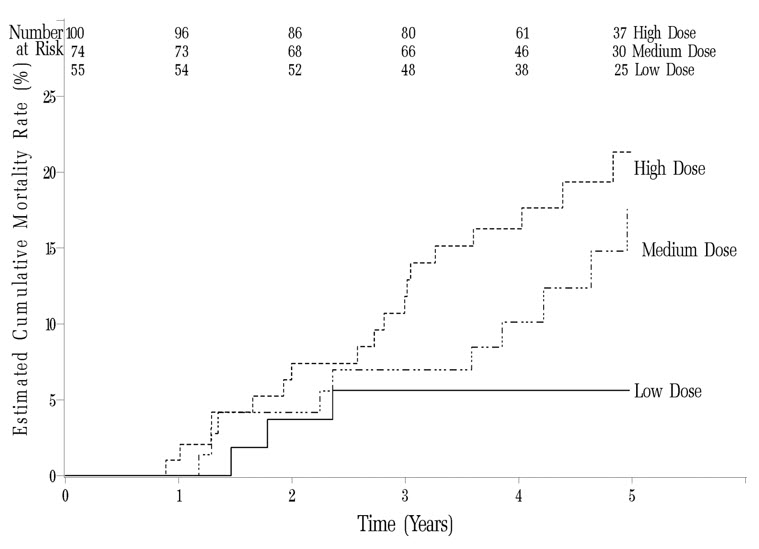
A Kaplan-Meier survival curve chart showing estimated cumulative mortality rates over a 5-year period for three dose groups labeled High Dose, Medium Dose, and Low Dose. The y-axis represents estimated cumulative mortality rate (%) and the x-axis shows time in years. The chart includes counts of subjects at risk at different time points for each dose group.*
FDA Label Image

Chemical Structure (Sildenafil 07)

Chemical Structure (Sildenafil 07)
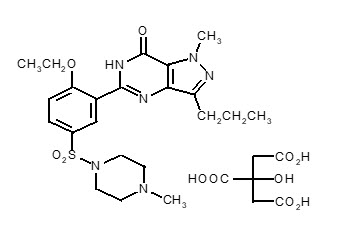
Chemical structure diagram of Sildenafil, the active ingredient labeled for the product by Unit Dose Services with NDC 50436-0034. The structure shows the molecular arrangement including rings, bonds, and functional groups typical for Sildenafil citrate.*
FDA Label Image

Figure 7 (Sildenafil 08)

Figure 7 (Sildenafil 08)
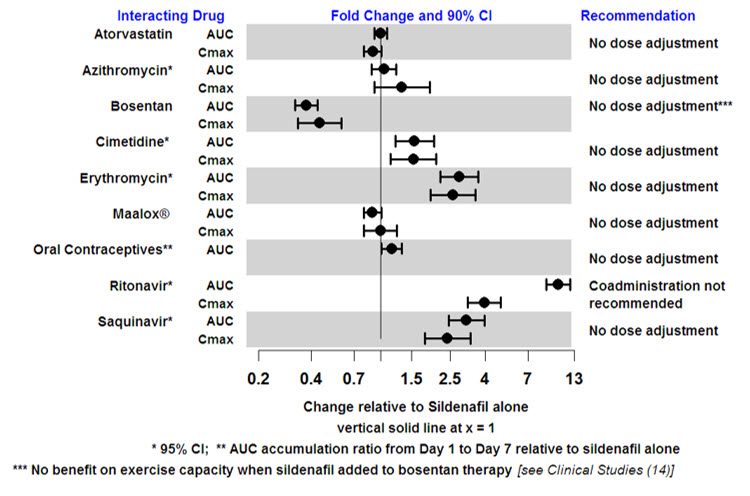
A forest plot chart showing the fold change and 90% confidence intervals in pharmacokinetic parameters (AUC and Cmax) of Sildenafil when coadministered with various interacting drugs. The x-axis represents the change relative to Sildenafil alone. The chart includes drugs such as Atorvastatin, Azithromycin, Bosentan, Cimetidine, Erythromycin, Maalox, Oral Contraceptives, Ritonavir, and Saquinavir, with corresponding dose adjustment recommendations.*
FDA Label Image

Figure 8 (Sildenafil 09)

Figure 8 (Sildenafil 09)
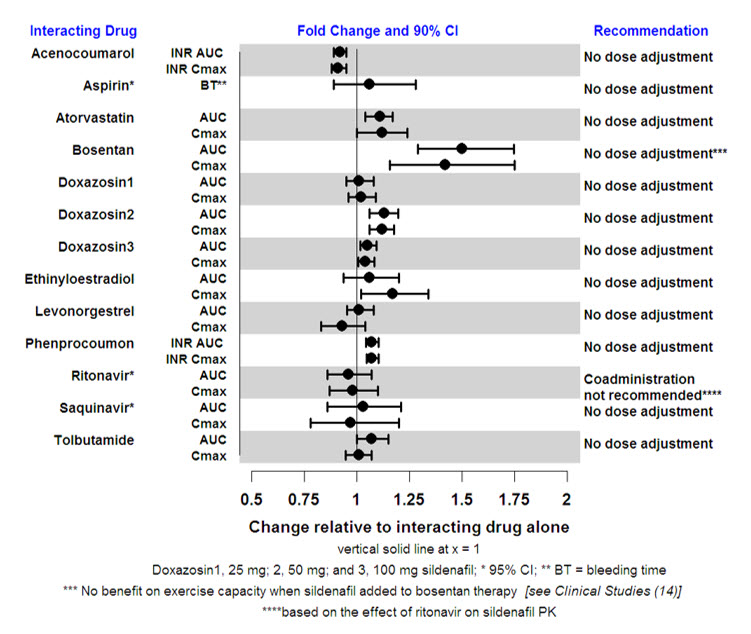
A forest plot chart showing fold change and 90% confidence intervals for the effect of various interacting drugs on sildenafil, with recommendations for dose adjustments. The chart lists interacting drugs on the left, fold change on the x-axis (0.5 to 2), and dosage recommendations on the right, mostly indicating no dose adjustment, except for ritonavir with a recommendation against coadministration. Footnotes clarify dosing details and specific study references.*
FDA Label Image

Figure 9 (Sildenafil 10)

Figure 9 (Sildenafil 10)
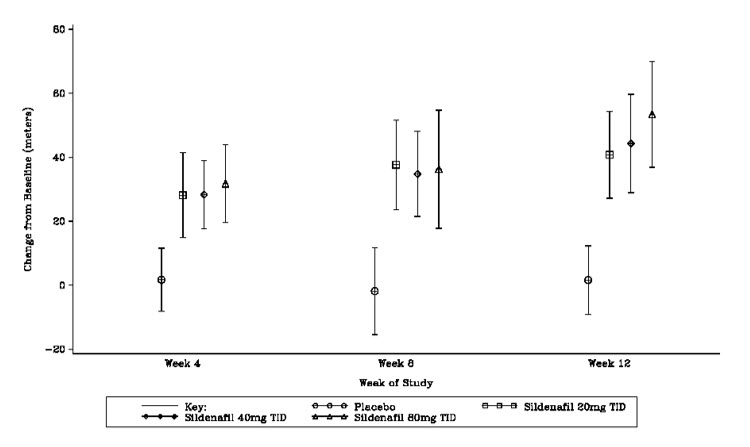
A line graph displaying change from baseline (meters) on the vertical axis against weeks of study (Week 4, 8, and 12) on the horizontal axis. The graph compares the effects of Placebo, Sildenafil 20 mg TID, Sildenafil 40 mg TID, and Sildenafil 80 mg TID, showing data points with error bars representing variability at each time point.*
FDA Label Image

Figure 10 (Sildenafil 11)

Figure 10 (Sildenafil 11)
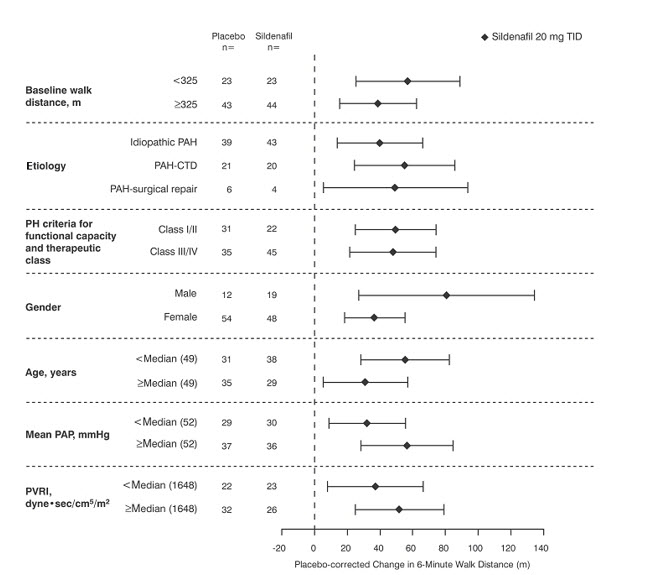
A horizontal forest plot showing placebo-corrected changes in 6-minute walk distance for Sildenafil 20 mg TID across various patient subgroups and baseline characteristics. The graph includes categories such as baseline walk distance, etiology, functional class, gender, age, mean pulmonary arterial pressure, and pulmonary vascular resistance index, with corresponding point estimates and 95% confidence intervals.*
FDA Label Image

Figure 11 (Sildenafil 12)

Figure 11 (Sildenafil 12)
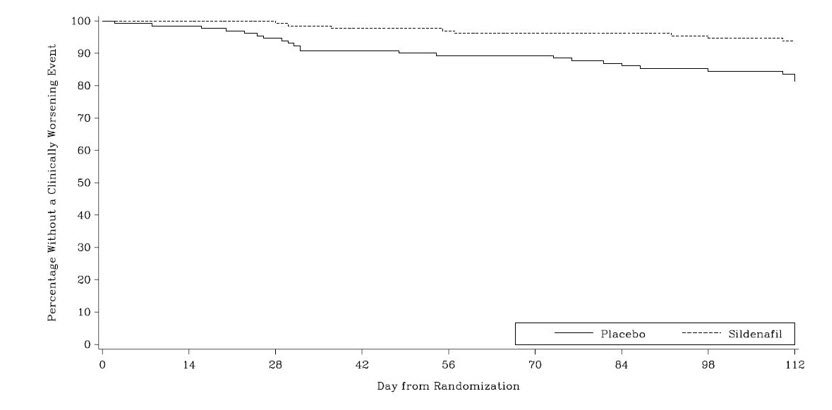
A line graph showing the percentage of subjects without a clinically worsening event over time from randomization. The x-axis represents days from randomization, up to 112 days, and the y-axis represents the percentage, ranging from 0 to 100. Two lines compare placebo (solid line) and Sildenafil (dashed line), with Sildenafil showing a consistently higher percentage of subjects without clinical worsening over time.*
FDA Label Image

Figure 12 (Sildenafil 13)

Figure 12 (Sildenafil 13)
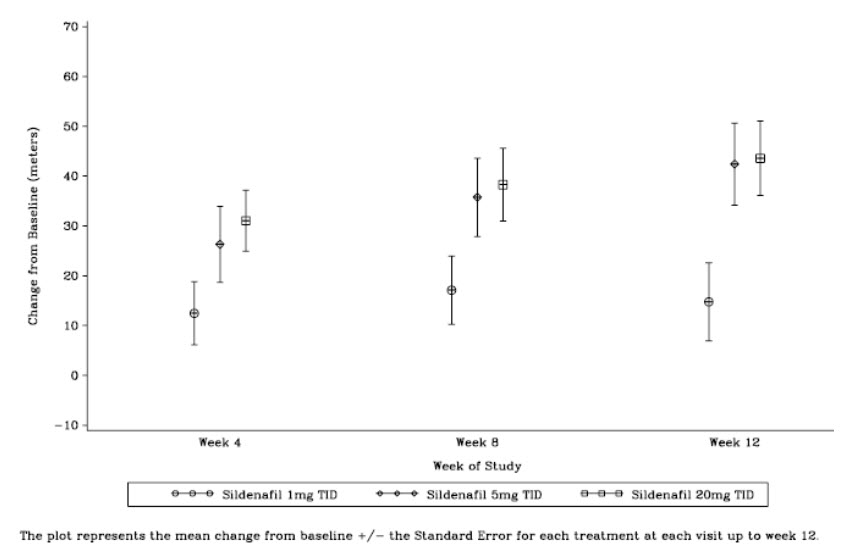
A line plot showing the mean change from baseline in meters over a 12-week study period for three Sildenafil doses: 1 mg TID, 5 mg TID, and 20 mg TID. The x-axis represents weeks (4, 8, 12), and the y-axis shows the change from baseline with standard error bars for each dose at each visit.*
FDA Label Image

Logo (Sildenafil 14)

FDA Label Image

Logo (Sildenafil 15)

FDA Label Image

Figure A (Sildenafil 16)

Figure A (Sildenafil 16)
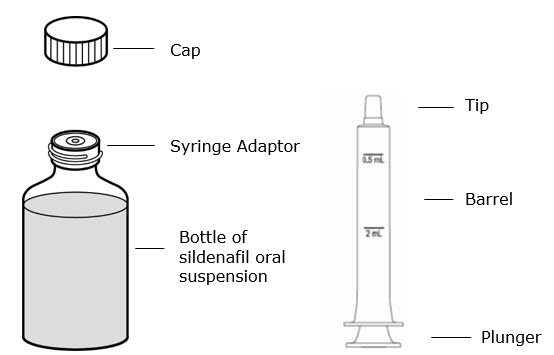
An instructional diagram depicting components of a sildenafil oral suspension packaging. It shows a capped bottle labeled as containing sildenafil oral suspension with a syringe adaptor attached to the bottle neck. Next to the bottle is a labeled syringe consisting of a tip, barrel with graduation marks (0.5 mL and 2 mL), and a plunger.*
FDA Label Image

Figure B (Sildenafil 17)

Figure B (Sildenafil 17)
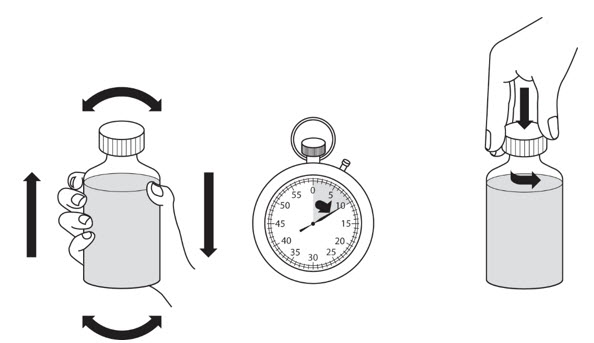
An instructional illustration showing three steps for opening or handling a medication bottle. The first panel depicts a hand holding the bottle with arrows indicating twisting motions. The second panel shows a stopwatch with pointers, suggesting timing or waiting. The third panel portrays a hand pressing down on the bottle cap with a downward arrow, indicating a push-and-turn mechanism to open the bottle.*
FDA Label Image

Figure C (Sildenafil 18)

Figure C (Sildenafil 18)
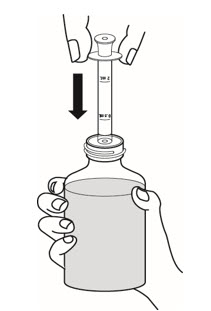
An instructional illustration showing a hand holding a bottle while another hand inserts a dosing syringe into the bottle's neck. This image likely depicts a step in measuring or withdrawing liquid medication with the syringe from the bottle.*
FDA Label Image

Figure D (Sildenafil 19)

Figure D (Sildenafil 19)
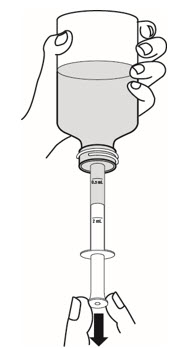
An illustration showing a bottle being held in one hand, with a syringe inserted into the bottle's opening. The other hand is pulling the syringe plunger down, indicating the drawing of liquid medication from the bottle into the syringe.*
FDA Label Image

Figure E (Sildenafil 20)

Figure E (Sildenafil 20)
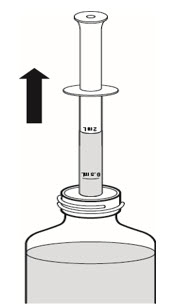
An instructional illustration showing a syringe inserted into a vial with an upward arrow indicating the syringe plunger should be pulled up. The image appears to demonstrate how to draw medication from the vial using the syringe.*
FDA Label Image

Figure F (Sildenafil 21)

Figure F (Sildenafil 21)
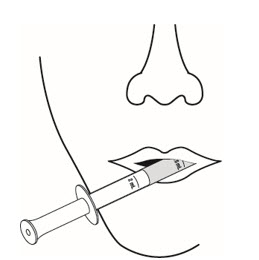
An instructional line drawing showing a syringe administering medication by injecting through a thin film or strip held inside a mouth, illustrating a sublingual or buccal administration method.*
FDA Label Image

Figure G (Sildenafil 22)

Figure G (Sildenafil 22)
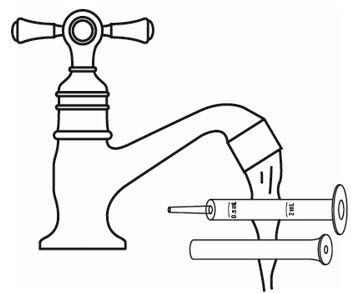
An instructional illustration showing a faucet with water flowing into a syringe. The syringe is marked with volume measurements of 1 mL and 2 mL and is positioned horizontally under the faucet to collect the water. The image likely demonstrates how to fill the syringe accurately.*
FDA Label Image

Logo (Sildenafil 23)

Logo (Sildenafil 23)
Label segment showing the Greenstone Brand logo and text indicating distribution by Greenstone LLC, Peapack, NJ 07977.*

* About these descriptions: Image descriptions on this page are generated by automated AI analysis of the product label images from the manufacturer's FDA label submission (SPL). They are provided for reference only and may contain errors or omissions. Always rely on the printed label itself and the official FDA labeling, and consult a pharmacist or healthcare professional with any questions about this product.