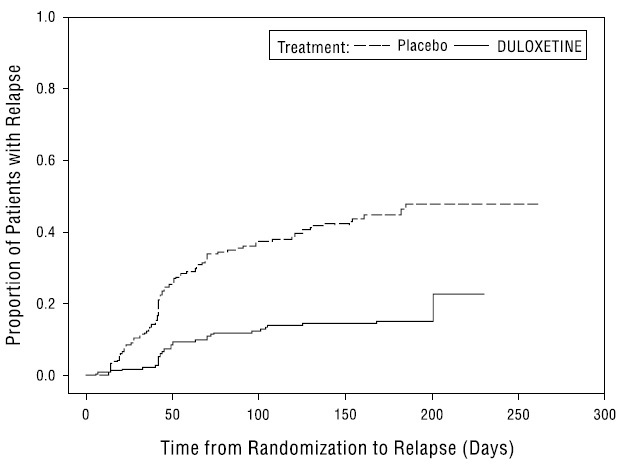
Figure1 (Duloxetine Fig1)
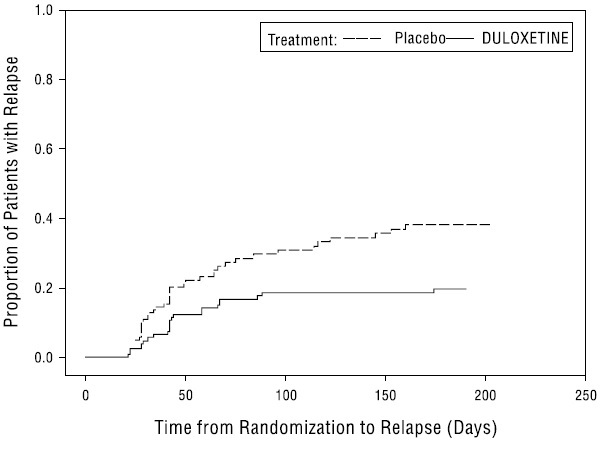
This appears to be a graph or chart showing the number of patients with relapse over time from randomization to relapse (measured in days) for a treatment comparison between placebo and duloxetine. The graph displays data points at 100, 150, 200, and 250 days. No additional information or context is provided, so the purpose or source of the data is not clear.*