Rabeprazole Sodium
Product Images NDC 50436-0302

6 FDA label images from Unit Dose Services · Packaging, Regulatory Labels, and Product Appearance

Product Visual Gallery

This gallery contains 6 technical images submitted to the FDA as part of the official labeling for Rabeprazole Sodium (NDC 50436-0302). Unlike standard consumer photos, these assets often include clinical data figures, molecular chemical structures, and official manufacturer packaging layouts.

As provided by Unit Dose Services, these visuals offer a comprehensive scientific overview of the product's physical and chemical identity, aiding pharmacists and researchers in product verification and study.

FDA Label Image

Label Image (Lbl504360302)

Label Image (Lbl504360302)
Rabeprazole Sodium delayed-release 20 mg tablet carton from Unit Dose Services. The package contains 30 tablets, manufactured by Kremers Urban Products, Inc. The label includes storage and safety warnings, lot number, and expiration date fields.*
FDA Label Image

Figure 1 (Rabeprazole Sodium Delayed Release Tablets 1)

Figure 1 (Rabeprazole Sodium Delayed Release Tablets 1)
Chemical structure of rabeprazole sodium, showing its molecular framework with a benzimidazole ring linked to a sulfinyl group, a substituted pyridine ring, and ether side chains. This diagram illustrates the arrangement of atoms and bonds typical for rabeprazole sodium.*
FDA Label Image

Figure 2 (Rabeprazole Sodium Delayed Release Tablets 2)

Figure 2 (Rabeprazole Sodium Delayed Release Tablets 2)
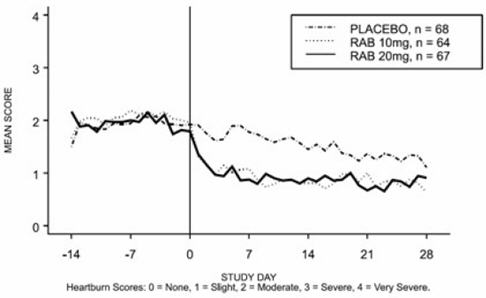
A line graph depicting mean heartburn scores over a 28-day study period comparing Placebo, Rabeprazole 10 mg, and Rabeprazole 20 mg groups. The x-axis represents study days from -14 to 28, and the y-axis shows mean scores from 0 (none) to 4 (very severe). The graph shows decreasing heartburn severity in Rabeprazole groups after study day 0 compared to placebo.*
FDA Label Image

Figure 3 (Rabeprazole Sodium Delayed Release Tablets 3)

Figure 3 (Rabeprazole Sodium Delayed Release Tablets 3)
A line graph showing mean heartburn scores over a 28-day study period comparing placebo, Rabeprazole Sodium 10 mg, and Rabeprazole Sodium 20 mg groups. The x-axis is labeled as Study Day, and the y-axis shows Mean Score from 0 to 4, where 0 means no heartburn and 4 means very severe. The graph includes data for days before and after study start (day 0).*
FDA Label Image

Figure 4 (Rabeprazole Sodium Delayed Release Tablets 4)

Figure 4 (Rabeprazole Sodium Delayed Release Tablets 4)
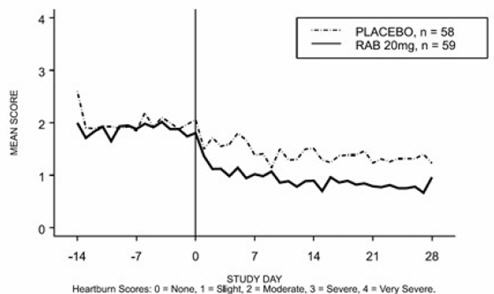
A line graph showing mean heartburn scores over a 28-day study period comparing placebo and Rabeprazole Sodium 20 mg groups. The X-axis represents study days from -14 to 28, and the Y-axis shows mean heartburn scores from 0 (None) to 4 (Very Severe). Rabeprazole 20 mg group demonstrates a greater reduction in heartburn scores after day 0 compared to placebo.*
FDA Label Image

Figure 5 (Rabeprazole Sodium Delayed Release Tablets 5)

Figure 5 (Rabeprazole Sodium Delayed Release Tablets 5)
A line graph comparing mean heartburn scores over 28 study days between two groups: placebo and Rabeprazole Sodium 20 mg. The vertical axis shows mean scores ranging from 0 (none) to 4 (very severe), and the horizontal axis shows study days from -14 to 28. Scores decrease over time in both groups, with Rabeprazole Sodium showing a lower trend post-day 0.*

* About these descriptions: Image descriptions on this page are generated by automated AI analysis of the product label images from the manufacturer's FDA label submission (SPL). They are provided for reference only and may contain errors or omissions. Always rely on the printed label itself and the official FDA labeling, and consult a pharmacist or healthcare professional with any questions about this product.