Product Images Tadalafil

View Photos of Packaging, Labels & Appearance

Product Label Images

The following 10 images provide visual information about the product associated with Tadalafil NDC 50436-0370 by Unit Dose Services, such as packaging, labeling, and the appearance of the drug itself. This resource could be helpful for medical professionals, pharmacists, and patients seeking to verify medication information and ensure they have the correct product.

Label Image - lbl504360370

Label Image - lbl504360370

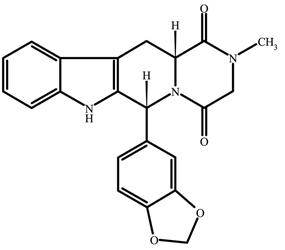
This is a description of a medicine called Tadalafil. It comes in the form of tablets, with each containing 5mg of Tadalafil USP. The tablets should be kept in light containers, at a controlled room temperature of 23 degrees Celsius. The package insert contains instructions on dosage information. The medicine is RX only, and the lot numbers are listed as 00X, LTY B 9000, and O ooy B 00. The text also includes several warnings, including to keep the medicine out of reach of children, and to only take the prescribed dose.*

Figure - tadalafil figure1

Figure - tadalafil figure1

The text appears to be a table showing the difference in blood pressure (measured in mmHg) between Tadalafil and Placebo for both standing and supine positions. However, without a proper table format and context, it is difficult to provide a more specific description.*

Figure - tadalafil figure2

Figure - tadalafil figure2

The text appears to be a mix of numerical values, symbols, and scattered letters/words. It is not possible to generate a useful description.*

Figure - tadalafil figure3

Figure - tadalafil figure3

Figure - tadalafil figure4

Figure - tadalafil figure4

This is a chart showing plasma tadalafil concentrations in ug/L over time for different doses and durations of administration. The doses evaluated are a single 20-mg tadalafil dose, a single 5-mg tadalafil dose, and once-daily 5-mg tadalafil following 5 consecutive days of administration. The x-axis shows time in hours up to 120 hours, and the y-axis shows plasma tadalafil concentration in ug/L.*

Figure 5 - tadalafil figure5

Figure 5 - tadalafil figure5

The text is describing the change in IPSS total score as a result of either taking tadalafil or a placebo during a treatment that lasted for 12 weeks. The graph displays a significant difference between the two groups with a p-value of less than 0.01.*

Figure 6 - tadalafil figure6

Figure 6 - tadalafil figure6

Figure 7 - tadalafil figure7

Figure 7 - tadalafil figure7

Not available.*

Figure 8 - tadalafil figure8

Figure 8 - tadalafil figure8

Chemical Structure - tadalafil structure

Chemical Structure - tadalafil structure

* The product label images have been analyzed using a combination of traditional computing and machine learning techniques. It should be noted that the descriptions provided may not be entirely accurate as they are experimental in nature. Use the information in this page at your own discretion and risk.