Tamsulosin Hydrochloride
Product Images NDC 50436-0598

View Photos of Packaging, Regulatory Labels, and Product Appearance

Product Visual Gallery

This gallery contains 7 technical images submitted to the FDA as part of the official labeling for Tamsulosin Hydrochloride (NDC 50436-0598). Unlike standard consumer photos, these assets often include clinical data figures, molecular chemical structures, and official manufacturer packaging layouts.

As provided by Unit Dose Services, these visuals offer a comprehensive scientific overview of the product's physical and chemical identity, aiding pharmacists and researchers in product verification and study.

FDA Label Image

Label Image (Lbl504360598)

Label Image (Lbl504360598)
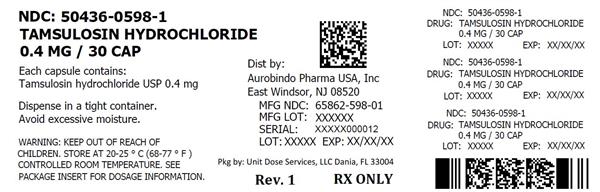
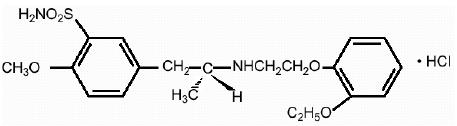
Drug description: Tamsulosin Hydrochloride AL, 0.4mg/30 capsules. Each capsule contains 0.4mg of Tamsulosin hydrochloride USP. The drug should be stored in a tight container and kept away from excessive moisture. The label also indicates the manufacturer's information, NDC code, dosage information as well as manufacturing information such as the LOT number and EXP date.*
FDA Label Image

Figure 1 Mean Plasma Tamsulosin Hydrochloride Concentrations Following Single-dose Administration Of Tamsulosin Hydrochloride Capsules 0.4 mg Under Fasted And Fed Conditions (n=8) (Tamsulosin Fig1)

Figure 1 Mean Plasma Tamsulosin Hydrochloride Concentrations Following Single-dose Administration Of Tamsulosin Hydrochloride Capsules 0.4 mg Under Fasted And Fed Conditions (n=8) (Tamsulosin Fig1)
The text provided is a figure caption showing a graph of the mean plasma concentration of Tamsulosin Hydrochloride Capsules at 0.4mg under fasted and fed conditions. The graph is divided into two parts, one for the fasted condition and another for the fed condition. The X-axis shows the time in hours and the Y-axis shows the plasma concentration. There is no additional information available in the given text.*
FDA Label Image

Figure 2a Mean Change From Baseline In Total Aua Symptom Score (0 To 35) Study 1 (Tamsulosin Fig2)

FDA Label Image

Figure 2b Mean Change From Baseline In Total Aua Symptom Score (0 To 35) Study 2 (Tamsulosin Fig3)

FDA Label Image

Figure 3a Mean Increase In Peak Urine Flow Rate (ml/sec) Study 1 (Tamsulosin Fig4)

Figure 3a Mean Increase In Peak Urine Flow Rate (ml/sec) Study 1 (Tamsulosin Fig4)
This is a figure from Study 1 showing the mean increase in peak urine flow rate (in L/sec) among different treatment groups. The treatments were 0.08 mg and 0.4 mg compared to a placebo. The mean change in flow rate is shown in mL/sec, with data collected over a period of 10 to 13 weeks (depending on the group). The figure includes a graph of the changes in flow rate over time.*
FDA Label Image

Figure 3b Mean Increase In Peak Urine Flow Rate (ml/sec) Study 2 (Tamsulosin Fig5)

Figure 3b Mean Increase In Peak Urine Flow Rate (ml/sec) Study 2 (Tamsulosin Fig5)
The text describes a figure labeled "Figure 3B" that shows the mean increase in peak urine flow rate in mL/sec for a study labeled "Study 2". The figure includes a graph with treatment listed on the x-axis and duration of treatment in weeks on the y-axis. However, there is no readable data or information related to the treatments, and the text is mostly made up of symbols and non-readable characters, so no further useful description can be generated.*
FDA Label Image

Chemical Structure (Tamsulosin Str)

* These product label images have been analyzed using experimental machine learning. Please verify findings with the primary label text.