Sevelamer Carbonate
Product Images NDC 50436-0893

View Photos of Packaging, Regulatory Labels, and Product Appearance

Product Visual Gallery

This gallery contains 4 technical images submitted to the FDA as part of the official labeling for Sevelamer Carbonate (NDC 50436-0893). Unlike standard consumer photos, these assets often include clinical data figures, molecular chemical structures, and official manufacturer packaging layouts.

As provided by Unit Dose Services, these visuals offer a comprehensive scientific overview of the product's physical and chemical identity, aiding pharmacists and researchers in product verification and study.

FDA Label Image

Label Image (Lbl504360893)

Label Image (Lbl504360893)
Sevelamer carbonate 800 mg tablets unit dose packaging label from Unit Dose Services. The label lists dosage form as tablets, with each unit dose pouch containing one tablet. It includes storage instructions to keep at 20°-25°C (68°-77°F), protect from moisture, and dispense in a tight, light-resistant container. The label displays manufacturer and repackager information, along with contact details and regulatory references.*
FDA Label Image

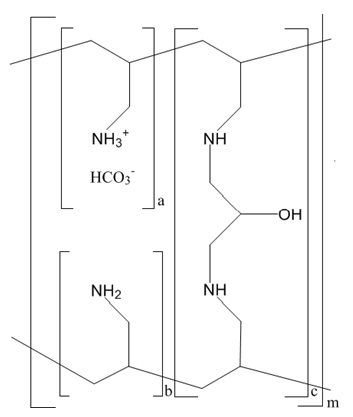
Chemical Structure/figure 1 (Sevelamer Carbonate Tabs Fig01)

Chemical Structure/figure 1 (Sevelamer Carbonate Tabs Fig01)
Chemical structure of the active ingredient sevelamer carbonate, depicting its polymeric amine and carbonate groups arranged in a repeating unit structure.*
FDA Label Image

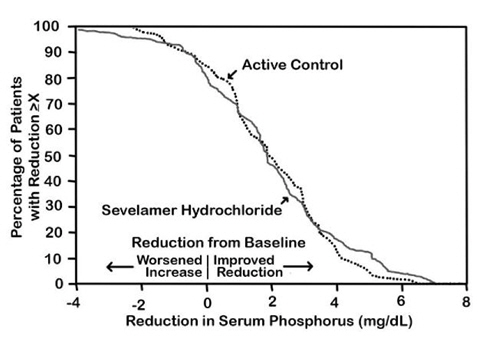
Figure 2 (Sevelamer Carbonate Tabs Fig02)

Figure 2 (Sevelamer Carbonate Tabs Fig02)
A line graph comparing the percentage of patients achieving various reductions in serum phosphorus levels (mg/dL) between Sevelamer Hydrochloride and an active control group. The x-axis shows reduction from baseline in serum phosphorus, ranging from worsening increase to improved reduction, while the y-axis shows the percentage of patients with reductions of at least the specified amount.*
FDA Label Image

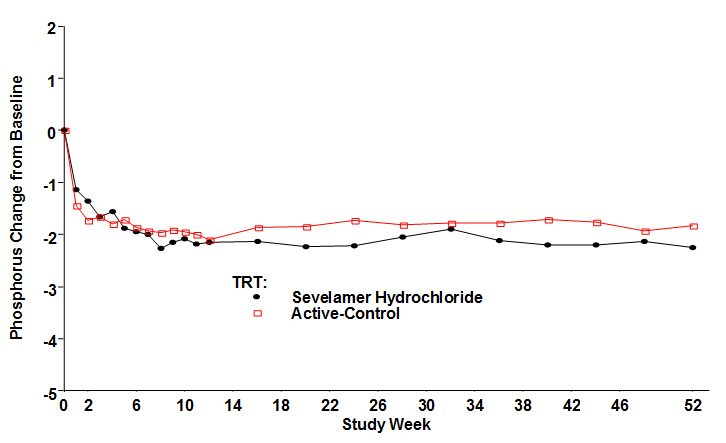
Figure 3 (Sevelamer Carbonate Tabs Fig03)

Figure 3 (Sevelamer Carbonate Tabs Fig03)
A line graph showing phosphorus change from baseline over a 52-week study period, comparing Sevelamer Hydrochloride and Active-Control treatments. The x-axis represents study weeks from 0 to 52, while the y-axis shows phosphorus change values ranging from -5 to +2. Data points for Sevelamer Hydrochloride are marked with black circles and for Active-Control with red squares, illustrating changes throughout the weeks.*

* About these descriptions: Image descriptions on this page are generated by automated AI analysis of the product label images from the manufacturer's FDA label submission (SPL). They are provided for reference only and may contain errors or omissions. Always rely on the printed label itself and the official FDA labeling, and consult a pharmacist or healthcare professional with any questions about this product.