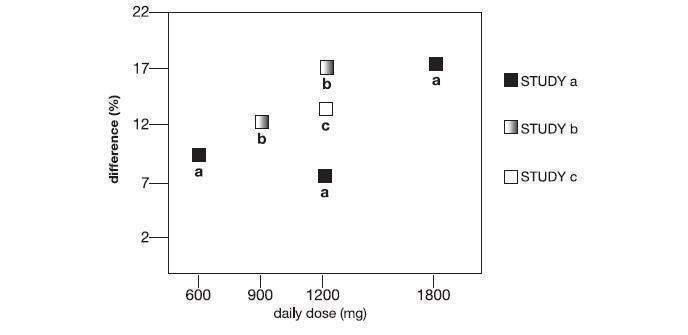
Fig1-2-3 (Fig123)
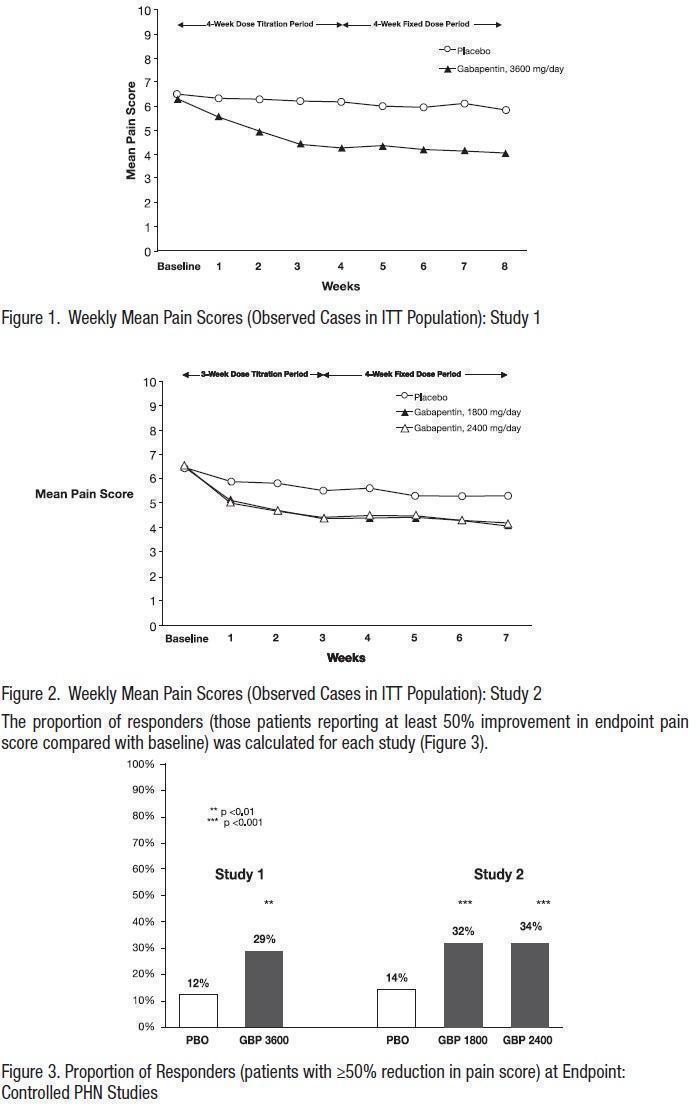
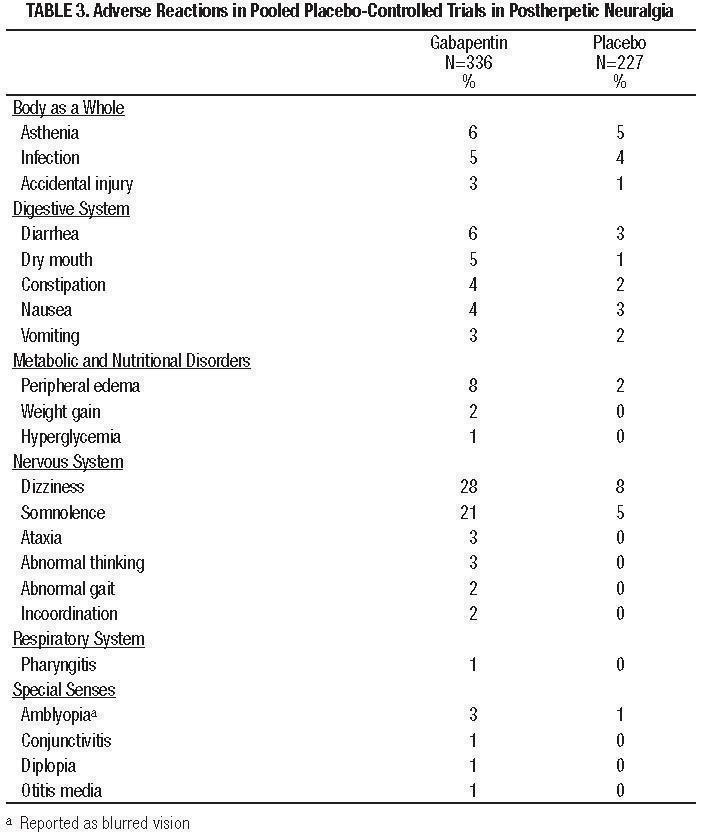
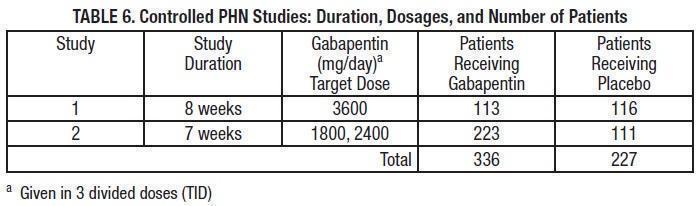
The text describes the results of two controlled PHN studies, and presents data on the weekly mean pain scores observed in ITT population as well as the proportion of responders, patients who reported at least a 50% improvement in endpoint pain score compared with baseline. Two figures (Figure 1 and Figure 2) show the weekly mean pain scores over time for the two studies respectively, and a third figure (Figure 3) presents the proportion of responders for each study with different doses of drugs.*