Label Image (Lbl504363011)
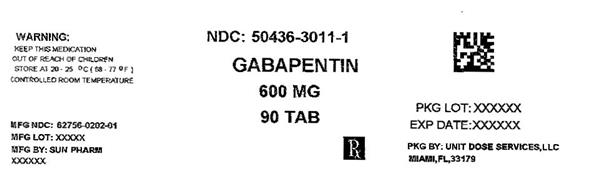
This is a warning label for a medication called Gabapentin. It contains 90 tablets, each with a dosage of 600mg. The package was produced by Unit Dose Services LLC, with a lot number of "X000" and an expiration date of "X0000K".*